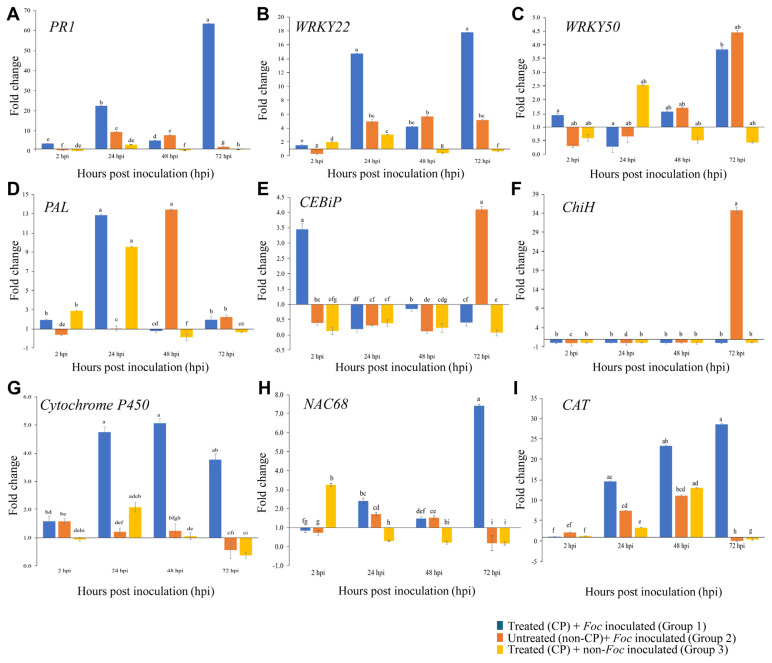
Fig. 4.
Relative expression value of PR1 (A), WRKY22 (B), WRKY50 (C), PAL (D), CEBiP (E), ChiH (F), Cytochrome P450 (G), NAC68 (H) and CAT (I) genes by qPCR in three different groups; treated (CP) + Foc inoculated (group 1), untreated (non-CP) + Foc inoculated (group 2) and treated (CP) + non-Foc inoculated (group 3). Target gene expression level was normalized to RPS2 reference gene. Relative expression value of the target genes was calculated based on the fold change value of ‘untreated (non-CP) + non-Foc inoculated’ (group 4) plants at 2 hpi. qPCR, quantitative polymerase chain reaction; CP, cold plasma; Foc, Fusarium oxysporum f. sp. cubense; hpi, hours post-inoculation. The bars represent the fold changes of the expression levels. All data were subjected to two-way ANOVA. The data shown are expressed as the mean (%) of three technical replicates from the pool of three biological replicates ± standard error. Error bar represents standard error; same letter denotes not significant (P > 0.05) by Tukey’s test.

