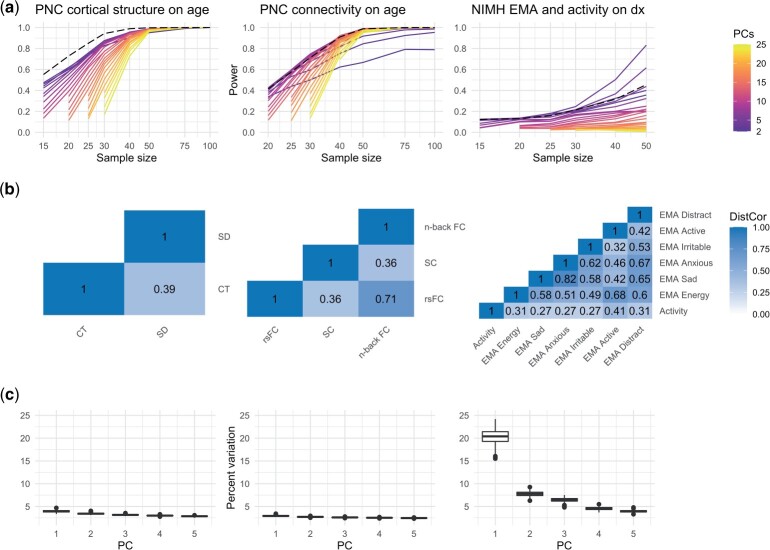
Fig. 4.
SiMMR-PC results across number of PCs and related exploratory analyses in real data applications. (a) shows the rejection rate across resamples for SiMMR-PC test statistics across number of PCs compared to SiMMR-D (dashed line). (b) displays the distance correlation (DistCor) among modalities in each application using the full sample. (c) shows the percent of variation explained by PCs across the 1,000 resamplings of size 50 in each application. PNC, Philadelphia Neurodevelopmental Cohort; EMA, ecological momentary assessment.

