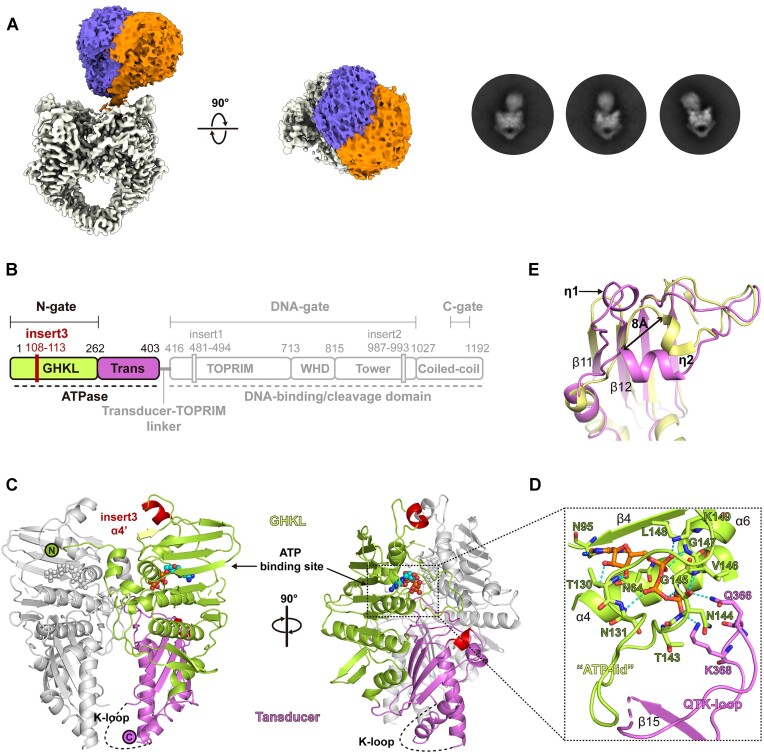
Figure 3.
Structure of the pP1192R ATPase domain. (A) 3D and 2D classification demonstrates the flexibility of the ATPase domain relative to the DNA-binding/cleavage domain. (B) The schematic representation of pP1192R. Functional domains, dimerization gates and sequence insertions are labeled. The domain organization of the ATPase domain is highlighted. (C) The dimeric structure of the ATPase domain of pP1192R. The domains in one protomer are colored as in (B), while the other protomer is colored gray. The α4’ helix (insert3) and η1 helix are highlighted in red. The ATP binding site is indicated by a dashed square. (D) Close-up view of the ATP binding site. Amino acids involved in hydrogen bonds and salt bridges with the AMP-PNP are shown as sticks and labelled. (E) Structural superimposition of the ATPase domains in pP1192R (yellow) and S. cerevisiae Topo II (purple) reveals the distinct conformation of the η2 helix in pP1192R ATPase domain.

