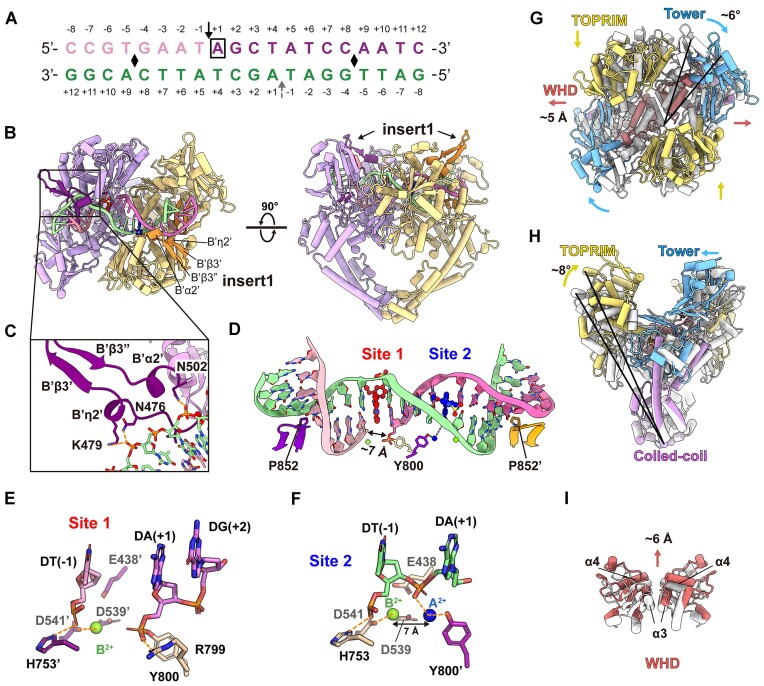
Figure 4.
Structure of the pP1192R–DNA–m-AMSA complex. (A) DNA substrate used for structural study. The cleavage sites are indicated by solid black arrow (at Site 1) and dashed grey arrow (at Site 2), respectively. Positive and negative numbers (+1 to +12 and –1 to –8) designate nucleotides downstream and upstream of the scissile phosphate, respectively, with the +1 nucleotide (boxed) at Site 1 forming a phosphotyrosyl linkage with Y800. Black diamonds indicate DNA bend points. (B) Orthogonal views of the pP1192R–DNA–m-AMSA complex. One protomer is shown in purple and the other in yellow. The two insert1 regions and the DNA duplex are highlighted. (C) Close-up views of the β-hairpin. Key amino acid side chains interacting with DNA are shown as sticks and labeled. Orange dashed lines depict hydrogen bonds. (D) Zoomed-in view of the DNA duplex configuration bent by pP1192R. The P852 inserted into the DNA minor groove is shown in stick and the DNA duplex is color as in (A). Two m-AMSA molecules are shown in red (at Site 1) and blue (at Site 1), respectively. Mg2+ ions are indicated by green spheres. (E and F) The positions of Mg2+ ions at post- (E) and pre-cleavage (F) sites, illustrating DNA (colored as in (D)), Mg2+ ions, catalytic amino acids (E…DxD) and metal coordination (indicated by orange dashed lines). (G–I) Structural superimposition of the pP1192R–DNA–m-AMSA complex and the apo structure (the C-gate closed state) reveals the conformational changes in DNA-contacting regions. The individual domains in the pP1192R–DNA–m-AMSA complex structure are colored as in Figure 1, while the apo structure is colored white.

