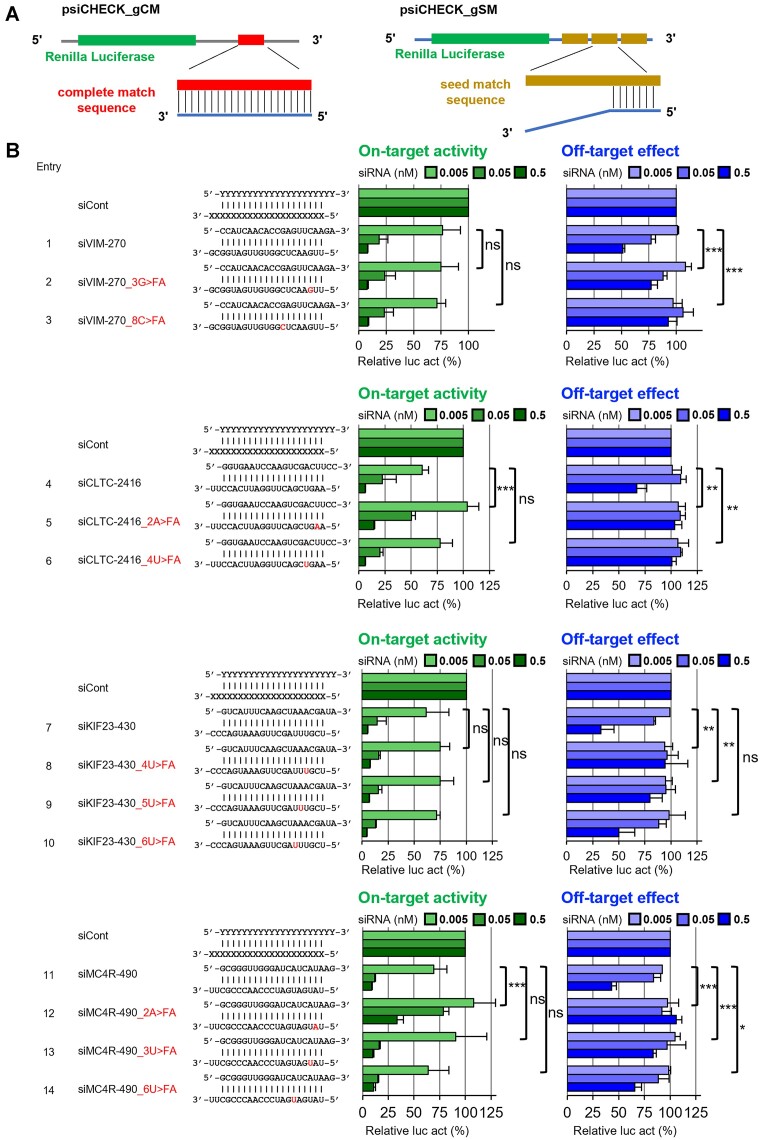
Figure 3.
RNAi on-target activity and off-target effects. (A) Vector design for evaluating on-target and off-target effects. (B) On-target activity and off-target effects. Upper RNA strand indicates the passenger strand, and the lower indicates the guide strand. Green graphs show on-target activity. The blue graphs show off-target effects. In the sequence, the red text indicates the position of the modifier. Relative luc activity (%) was calculated using the activity of Renilla luciferase and firefly luciferase transfected as a control. siRNA against green fluorescent protein (GFP) was used as control siRNA (siCont). The P-values were calculated using a Two-Way ANOVA test. Significance levels are indicated as follows: *P < 0.05, **P < 0.01, ***P < 0.001. Each experiment was repeated three times.

