Figure 4.
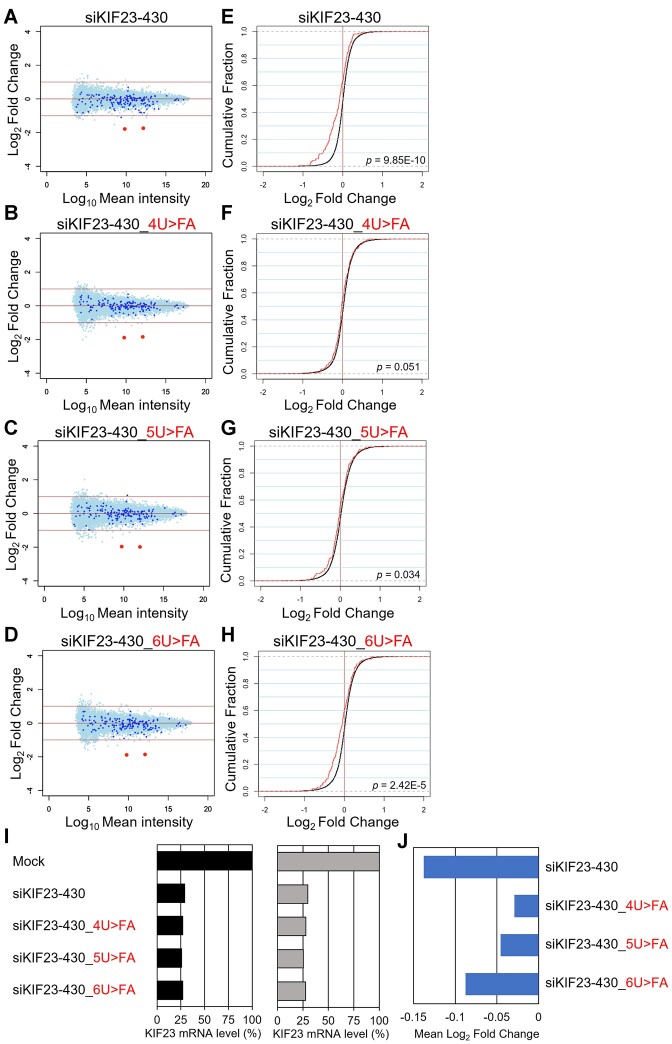
Microarray profiling of on-target and off-target effects of siKIF23-430 with 2′-formamido modifications. (A-D) MA plots showing log2 fold changes (vertical lines) and average log10 signal intensities (horizontal lines) of the expression levels of transcripts from the cells transfected with siKIF23-430 and its variants versus those from mock transfected cells. Dark blue dots represent 164 transcripts with siKIF23-430 SM sequence (off-target transcripts) in their 3′ UTRs, light blue dots represent 15 270 other transcripts without SM sequence (not off-target transcripts), and red dots denote two KIF23 splice variants (RefSeq: NM_001367804 and NM_138555, from the left). (E-H) Cumulative distributions of transcripts showing log2 fold changes (horizontal lines) and cumulative fractions (vertical lines). Red and black lines show the results for off-target and non-off-target transcripts, respectively. P-values were obtained using Wilcoxon rank-sum test. (I) The expression levels of two splice variants of KIF23 calculated by signal intensities compared to mock (black for RefSeq: NM_001367804, gray for NM_138555). (J) Seed-dependent off-target effects shown by mean log2 fold change for unmodified siKIF23-430 and 2′-formamido-modified siKIF23-430s at positions 4, 5, or 6.

