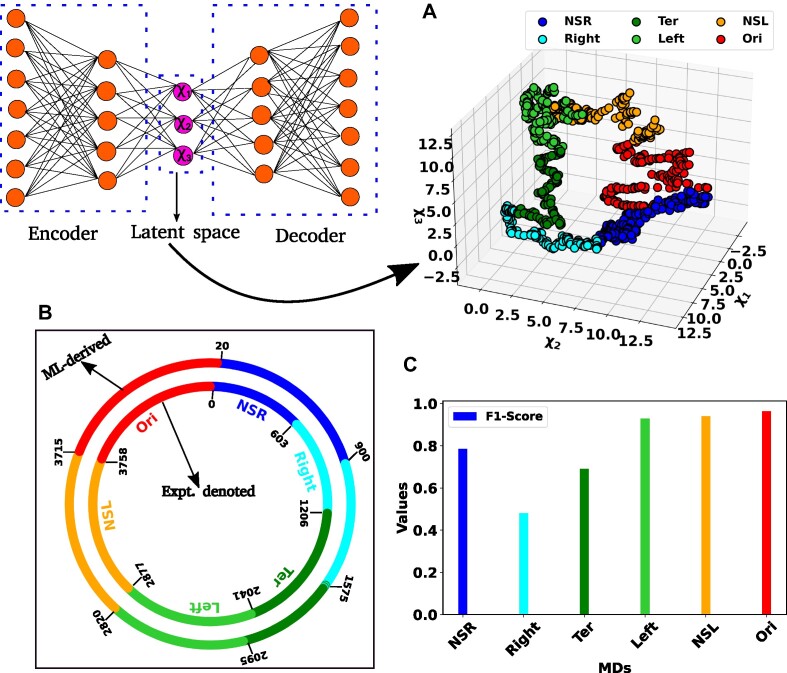
Figure 2.
Representation of the latent space and classification of different macrodomains. (A) Three dimensional scatter plot of the latent space variable χ1, χ2 and χ3. The data has been clustered using K-means clustering. The various color-coded clusters are representing distinct macrodomains (MDs) within the bacterial chromosome. (B) The comparison between experimentally denoted and machine learning (ML)-derived MDs. The inner and outer circles, each encoded by various color-coded regions, delineate the experimentally denoted and ML-derived macrodomains, respectively, with base pair information annotated in kilo bases (kb). (C) The bar plot of the F1-score for different MDs. The higher values of the F1-Score indicated the better classification.

