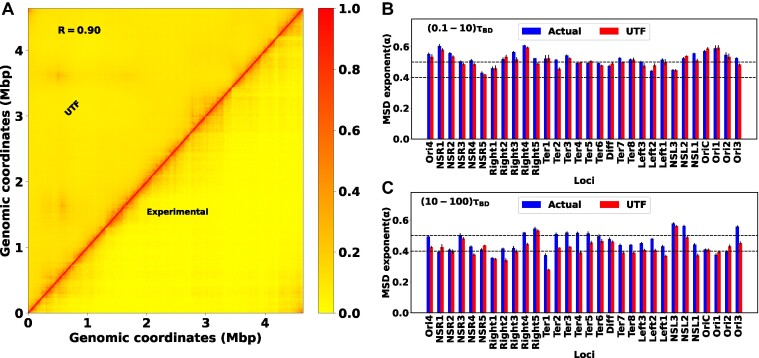
Figure 6.
Reproduce the structure and dynamics by using important features. (A) The heat map between the experimental and simulated (UTF) contact probability matrix for WT30MM. A PCC value of 0.90 between these matrices indicates strong agreement. The bar plot of the MSD exponent for different loci at two timescales: (B) (0.1−10)τBD and (C) (10−100)τBD, respectively. At a shorter time scale, the MSD exponent between the actual and UTF matches quite well. However, at a larger time scale, they start to deviate.

