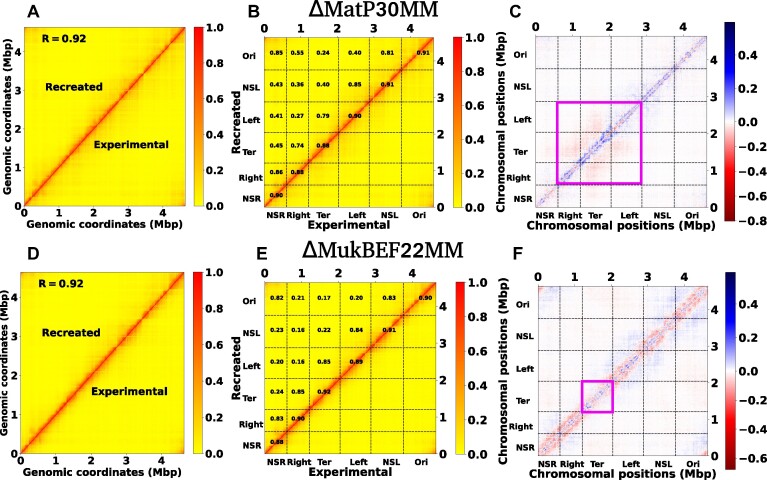
Figure 7.
Recreation of the Hi-C matrix for different mutant by using machine learning trained model on wild type Hi-C matrix. (A) Heat map between the experimental and ML recreated contact probability matrix for ΔMatP30MM. A Pearson correlation coefficient(PCC) value of 0.92 indicates a reasonably strong agreement between them. (B) Within the heat map of the contact probability matrix, individual PCC values for each MD are presented. The PCC are notably high between individual MDs and their adjacent MDs. (C) The heat map of the difference matrix (experimental and ML recreated) reveals a butterfly-shaped region inside the Ter and its flanking domains, denoted by the magenta box. This observation suggests that the ML-recreated matrix fails to accurately capture the interactions within the Ter and its nearby domains. (D–F) depict similar plots as in (A), (B) and (C), respectively. The only difference is that here we compare the experimental and ML recreated Hi-C matrix for ΔMukBEF22MM. From figure (F), it is evident that there are long-range contacts across all MDs except the Ter, suggesting that the ML-derived matrix cannot accurately capture the long-range reduction of contacts for all MDs except the Ter.

