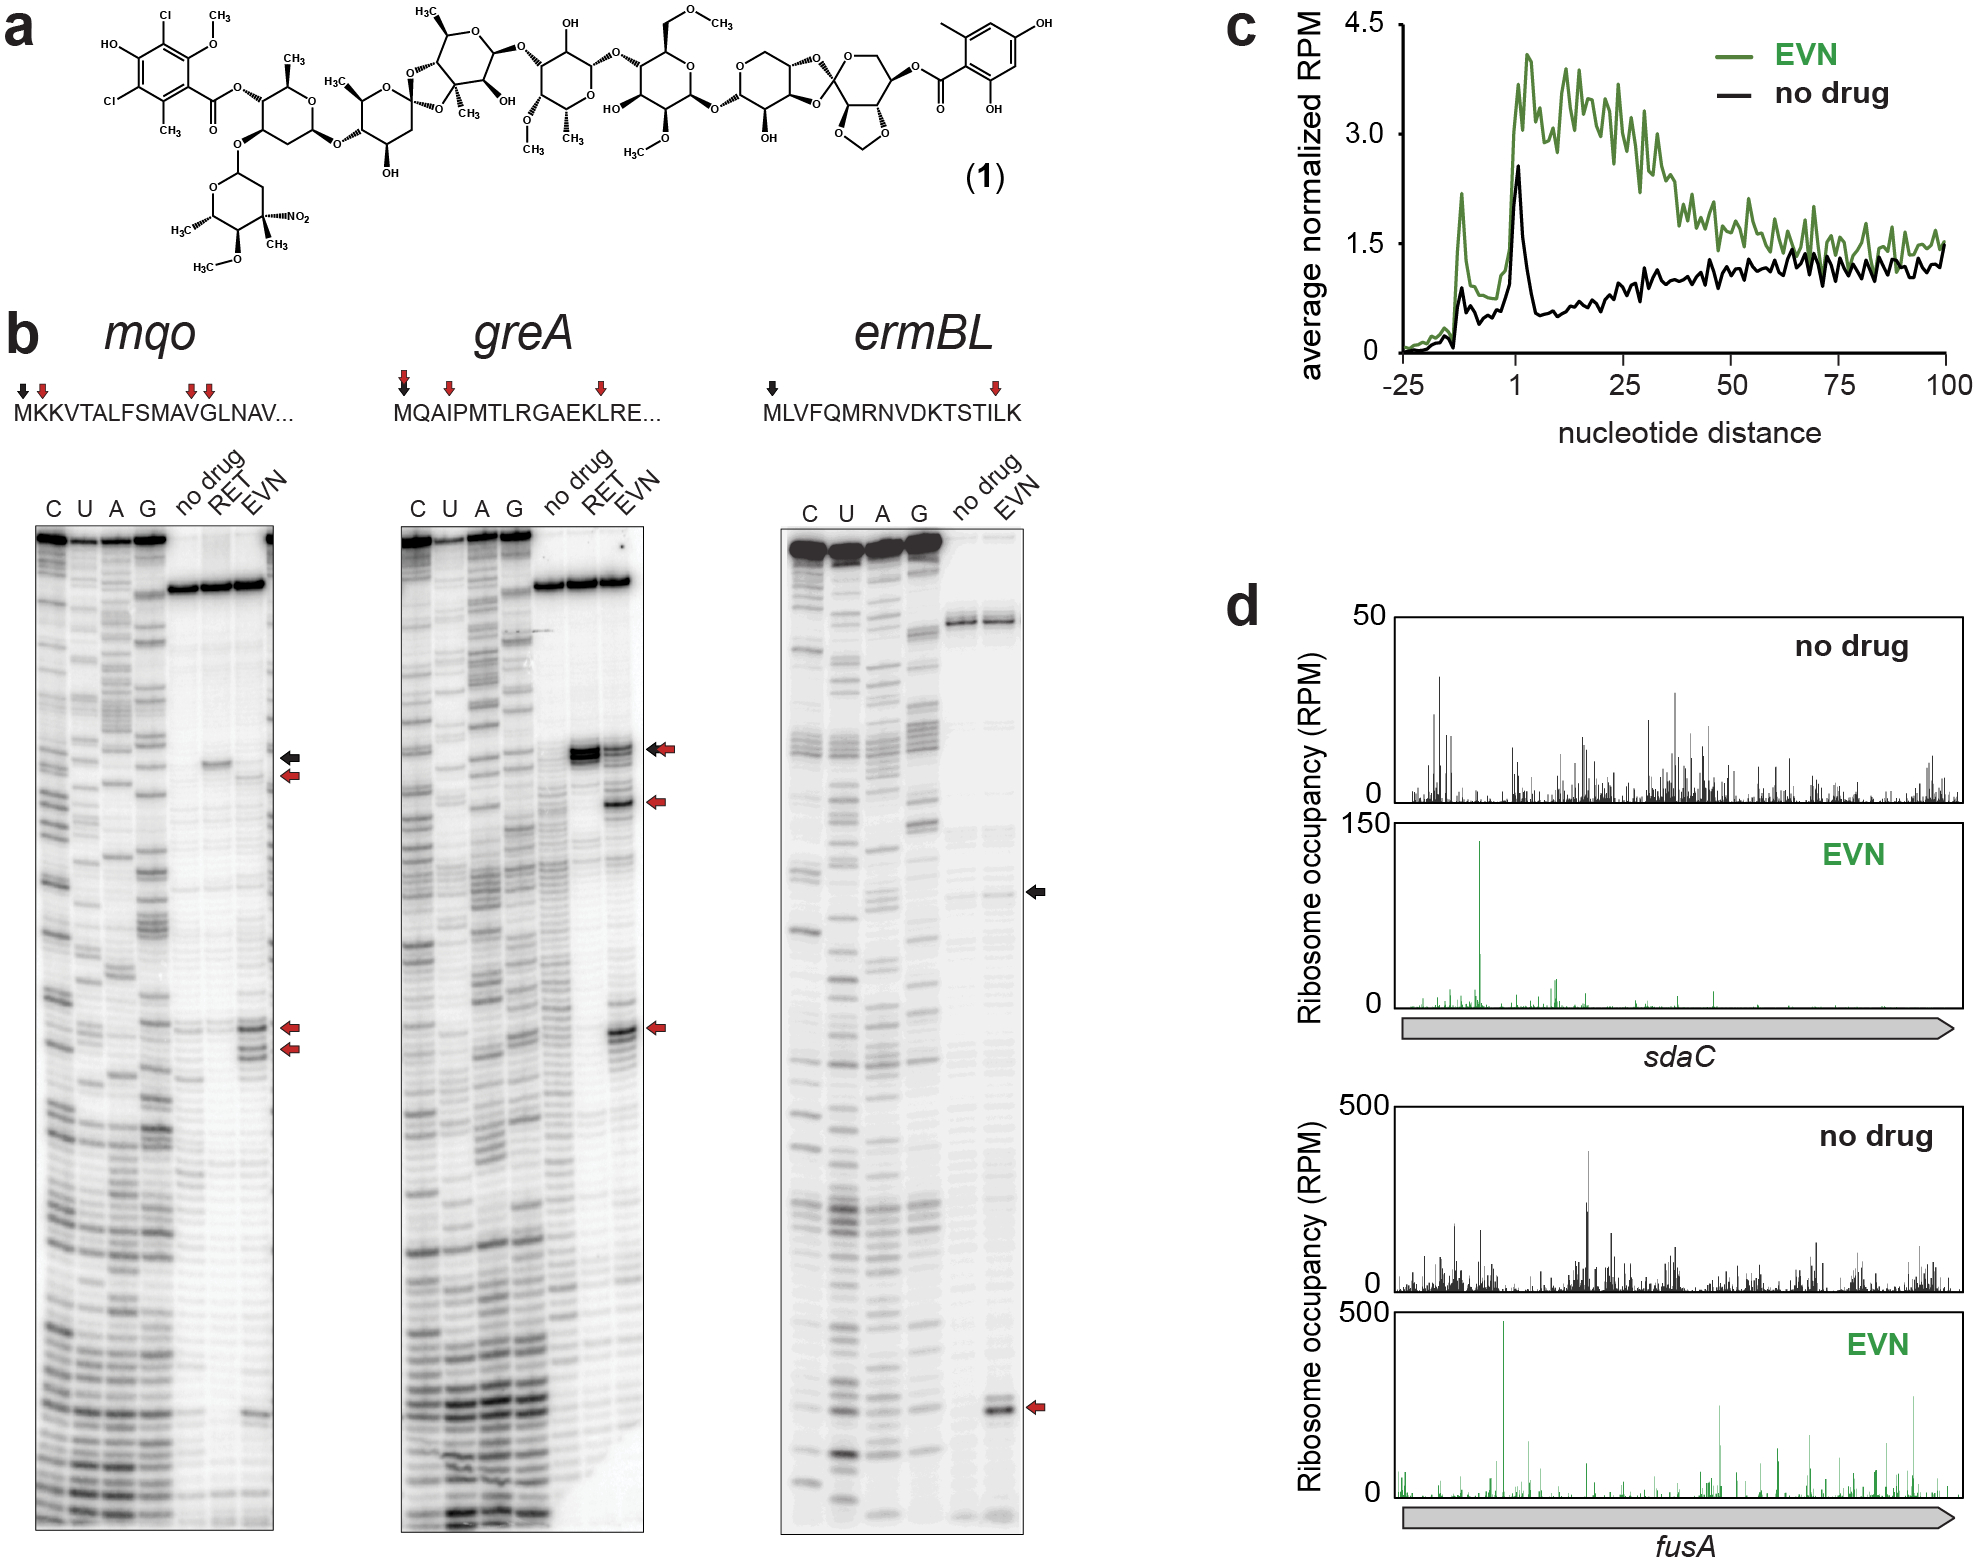
Figure 1: Evernimicin mainly inhibits translation elongation in vitro and in vivo.

a, Chemical structure of EVN. b, Mapping by toeprinting the sites of EVN-induced ribosome stalling during in vitro translation of different mRNA ORFs during in vitro translation. Selection of the model genes for in vitro experiments was based on the results of Ribo-seq analysis (mqo and greA) or previous reports (ermBL)13 Shown are representative gels from at least two independent experiments. Black arrows indicate ribosomes arrested at the start codons of the ORFs by the translation initiation inhibitor retapamulin (RET)20. Red arrows show the stalling sites of EVN-arrested ribosomes. c, Metagene analysis plots representing the distribution of ribosomes in the vicinity of start codons of actively translated genes in control cells (black) or cells treated with EVN (green). Included in the analysis were genes (n=1083) separated from the nearest upstream gene by >50 nucleotides. The nature of the ribosome density peak upstream from the start codon is unclear. d, Examples of individual genes where EVN causes general redistribution of translating ribosomes and ribosome accumulation at single (top) or multiple (bottom) sites within the ORF. Distribution of rfps along in the same genes in untreated cells is shown for comparison. See also Extended Data Fig. 4.
