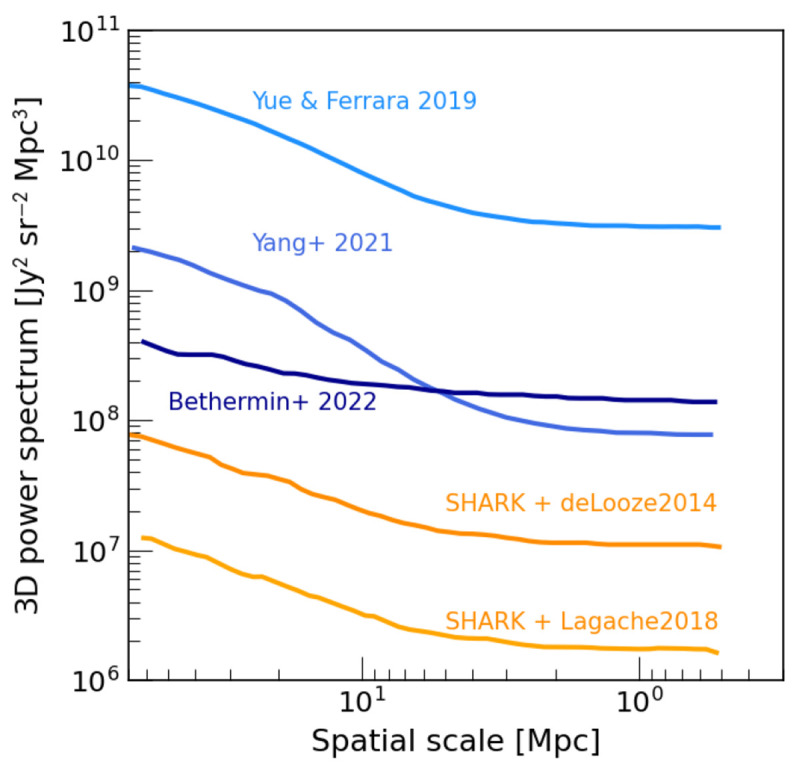
Figure 6. Line-intensity mapping: predicted 3D power spectrum of the [CII] emission at redshift z = 3.

Individual curves correspond to different analytical ( Yang et al., 2021; Yue & Ferrara, 2019) and N-body + semi-analytical models ( Béthermin et al., 2022; Lagos et al., 2020). We also show two realisations of the SHARK semi-analytical model coupled with two different prescriptions for [CII] emission ( Lagache et al., 2018). The predictions vary by over 3 dex; the large FoV and sensitivity of AtLAST will be critical for measuring LIM signal across cosmic time. Adapted from Béthermin et al. (2022), J. Hilhorst (MSc thesis).
