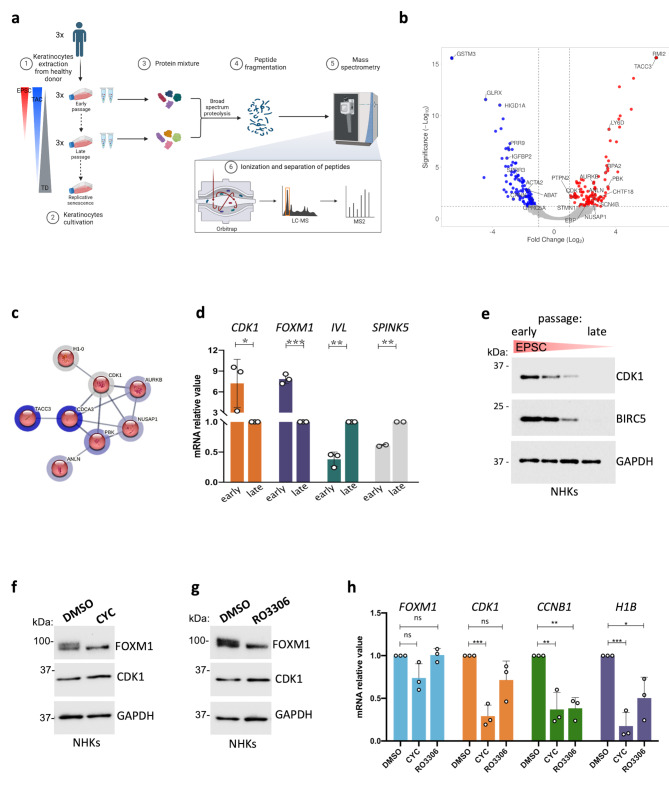
Fig. 1.
CDK1 is upregulated in stem-cell enriched epidermal cultures. (a) Scheme describing the experimental pipeline for mass spectrometry analysis; abbreviations: EPSC = Epidermal Stem Cell, TAC = Transient Amplifying Cell, TD = Terminally Differentiated cell, LC-MS = Liquid Chromatography Mass Spectrometry; MS = Mass Spectrometry; (b) Volcano plot representation of the proteins identified by the MS proteomics analysis of enriched vs. depleted samples. Significantly downregulated proteins are represented in blue, significantly upregulated proteins are represented in red. On X-axis, Fold-change is reported (log2(ratio)), while on Y-axis proteins’ significance is depicted (as -Log10 of the corresponding q-value). (c) STRING local Network analysis (LNA) obtained from the MCL cluster. Number of nodes: 8, number of edges: 12, average node degree: 3, avg. local clustering coefficient: 0.792, expected number of edges: 0, PPI enrichment p-value: 2.11 × 10− 15. (d) qRT-PCR quantification of the mRNA levels of CDK1, H1B, IVL, and SPINK5 on three different NHK primary cultures. Expression levels were normalized per GAPDH. Data are presented as mean +/− SD of N = 3 different independent biological replicates, *P < 0.05 (Student t-test). (e) Western analysis of total cell extracts from cultures generated by sub-confluent NHKs during serial cultivation. Molecular weight indicators are shown. (f) Western analysis of total cell extracts derived from NHK cultures treated with 30 μM CYC (see Methods) or DMSO as control. Molecular weight indicators are shown. (g) Western analysis of total cell extracts derived from NHK cultures treated with 30 μM RO3306 (see Methods) or DMSO as control. Molecular weight indicators are shown. (h) qRT-PCR quantification of the mRNA levels of FOXM1, CDK1, CCNB1, and H1B on cells derived from DMSO-, CYC- or RO3306-treated NHK cultures. Expression levels were normalized per GAPDH and given relative to the control (DMSO) arbitrarily set to 1. Data are presented as mean +/− SD of N = 3 different independent biological replicates, *P < 0.05, **P < 0.01, ***P < 0.001, ns = not significant (Student t-test)

