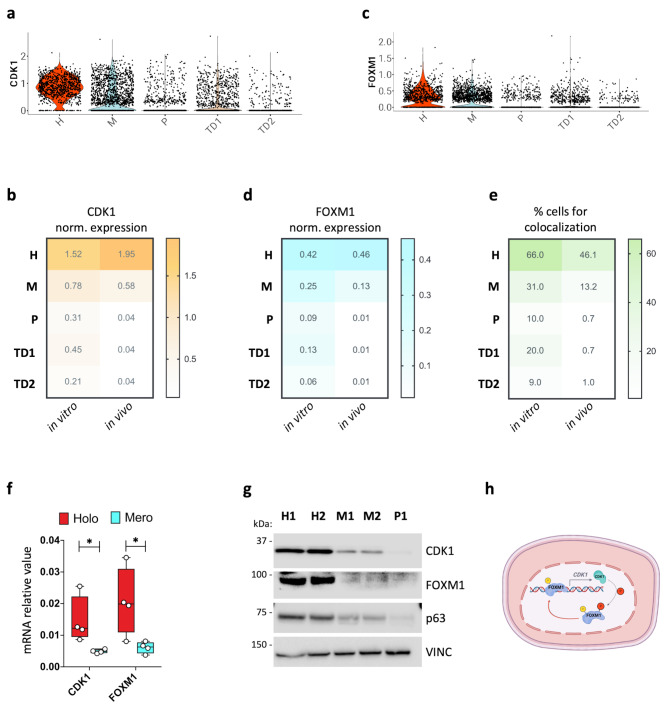
Fig. 3.
CDK1 expression at single cell level. (a, c) Violin plots showing CDK1 and FOXM1 expression across the H, M, P, TD1 and TD2 clusters derived from scRNA-seq data from in vitro-cultured NHK. (b, d, e) Heatmaps showing the percentage of cells in the H, M, P, TD1, and TD2 clusters derived from scRNA-seq data from in vitro culture (left column) and from skin biopsies (right column) expressing CDK1 (in orange), FOXM1 (in light blue) and containing at least one transcript of both FOXM1 and CDK1 (in green). Expression levels are given as normalized expressions (see Methods). (f) qRT-PCR quantification of the mRNA levels of CDK1 and FOXM1 on clones generated from at least two NHK cultures. Expression levels were normalized per GAPDH. Holoclones and meroclones are displayed in red and light blue, respectively. Data are presented as mean +/− SD of N = 5 different independent biological replicates, *P < 0.05 (Student t-test). (g) Western analysis of total cell extracts from cultures generated by holoclones (H1, H2), meroclones (M1, M2), and paraclone (P1) isolated by clonal analysis (see Methods) of sub-confluent NHKs. Molecular weight indicators are shown. (h) Schematic representation of the proposed mechanism. FOXM1 binds to CDK1 promoter, possibly enhancing its expression. CDK1 then phosphorylates FOXM1, further promoting its activity as a transcription factor on its target genes, among which CDK1. Created with BioRender

