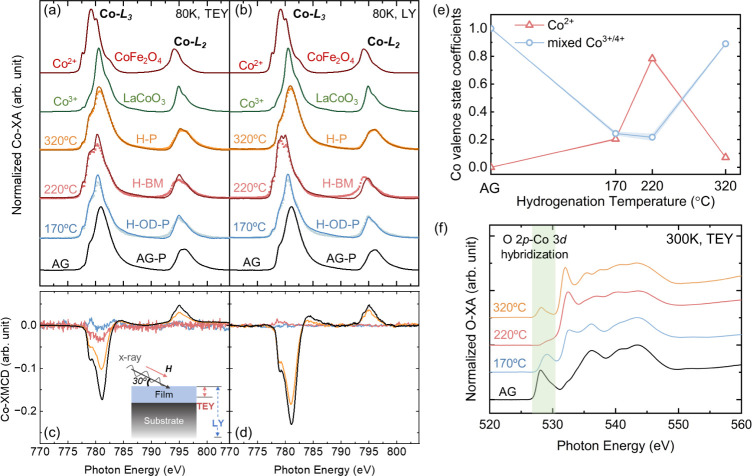
Figure 2.
Co L-edge XA of AG-P and hydrogenated-LSCO thin films measured in (a) the TEY mode and (b) the LY mode. Solid curves are experimental data, and symbols are fitting results. Co L-edge XA reference spectra (CoFe2O4, LaCoO3) are plotted. XA spectra are normalized from 0 to 1 and vertically shifted for clarity. Co L-edge XMCD measured in (c) TEY and (d) LY mode. The inset diagram in (c) represents the measurement geometry and the probing depth of TEY and LY detection modes. (e) Co-ion valence state fitting coefficients as a function of hydrogenation temperature. (f) O K-edge XA spectra taken at 300 K using the TEY mode. The shaded region in green represents the energy range associated with hybridization between O 2p and Co 3d orbitals.

