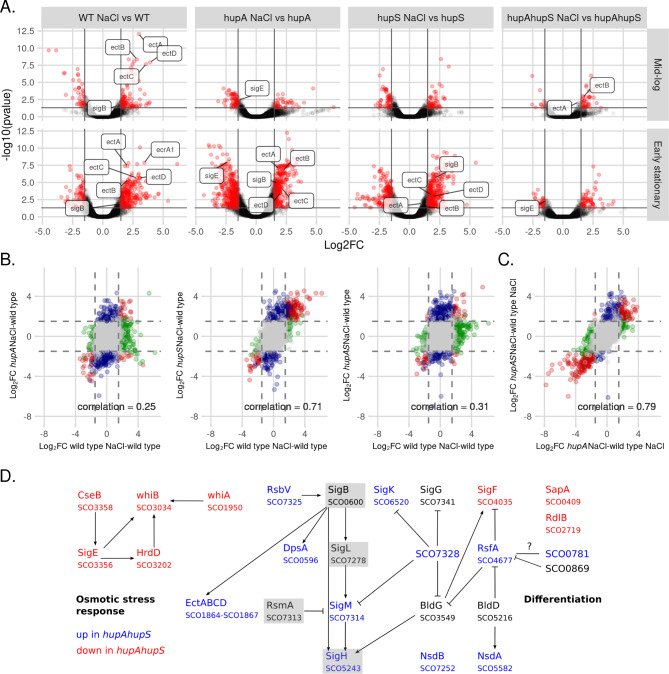
Fig. 5.
hupA deletion changes S. coelicolor response to growth in osmotic stress (A) Volcano plots showing changes in gene expression in wild type, ΔhupA, ΔhupS and ΔhupAΔhupS strains from mid-log and early stationary phase of growth in NaCl supplemented medium (0.5 M NaCl) compared to the same strain grown in standard YEME/TSB medium. For each strain significantly changed genes (FDR ≤ 0.05, |Log2FC| > 1.5) are shown in red. Chosen differentially expressed genes are labeled. (B) Scatterplots showing correlation between wild type and ΔhupA, ΔhupS and ΔhupAΔhupS Log2FC values during early stationary phase in medium supplemented with salt. Log2FC values were calculated from comparison with wild type strain grown in standard medium. Pearson correlation coefficient is shown on each plot. Genes found to be significant in both comparisons (FDR ≤ 0.05, |Log2FC| > 1.5) are shown in red, while genes significant in only one of the comparisons are marked as blue or green, grey dots represent genes not affected by hupA and/or hupS deletions. (C) Correlation between ΔhupA and ΔhupAΔhupS transcriptomes during early stationary phase in NaCl supplemented medium. The Pearson correlation coefficients are shown on the plot. Genes found to be significant in both comparisons (FDR ≤ 0.05, |Log2FC| > 1.5) are shown in red, while genes significant in only one of the comparisons are marked as blue or green, grey dots represent genes not affected by hupA and double hupAhupS deletions. (D) Regulatory networks involving selected upregulated (blue) or downregulated (red) genes in ΔhupAΔhupS strain during early stationary phase in NaCl supplemented medium (0.5 M NaCl)

