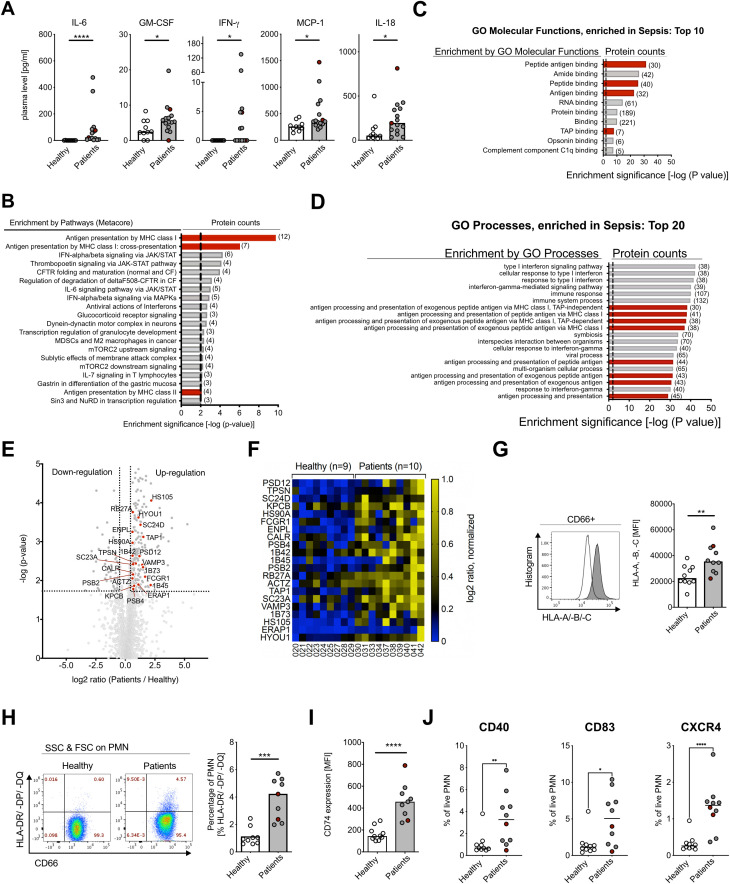
Figure 1.
Human neutrophils in gram-negative bacteremia show APC-like phenotype. (A) Plasma cytokine concentrations for IL-6, GM-CSF, IFN-γ, MCP-1, and IL-18 of healthy controls and patients. Medians, Mann–Whitney test. (B) Enriched pathways from proteomics analysis on neutrophils from healthy controls (n=9) and patients (n=10), using Metacore Enrichment by Pathway Maps. The P-value of proteomics data was set < 0.05, threshold = 0, top 20 hits with an enrichment significance of P-value < 0.01. Red bars highlight Antigen Presentation and processing by MHC class I and MHC class II as highly changed pathways in GN bacteremia patients. (C) Gene Ontology (GO) Molecular Functions Enrichment from proteomics analysis, using Metacore Enrichment by GO Molecular Functions. P-value of proteomics data was set < 0.05, threshold = 0, top 10 hits with an enrichment significance of P-value < 0.01. Red bars highlight Molecular Functions involved in Antigen processing and presentation in GN bacteremia. (D) GO Process Enrichment from proteomics analysis, using Metacore Enrichment by GO Processes. The P-value of proteomics data was set < 0.05, threshold = 0, top 20 hits with an enrichment significance of P-value < 0.01. Red bars highlight processes involved in Antigen processing and presentation in GN bacteremia. (E) Volcano dot plot from proteomics analysis. Highlighted proteins (red dots) are associated with Antigen presentation and processing by MHC class I and II, significance threshold (dotted line) was set at P-value < 0.02 and fold change ≤ 1.5 cutoff in order of P-value. (F) Heat map of proteins involved in Antigen presentation and processing by MHC class I and II, shown on an individual level with log2 ratio, normalized (0–1, blue to yellow). Significance threshold was set at P-value < 0.02 and fold change ≤ 1.5 cutoff in order of P-value. Protein names are used according to entry names in UniProt database (www.uniprot.org). (G) HLA-A, -B, -C (MHC class I) surface expression on neutrophils of healthy controls and patients, measured with flow cytometry, representative histogram (left) and statistical analysis (right, medians, Mann–Whitney test). (H) CD66b and HLA-DR/-DP/-DQ (MHC class II) surface expression on human neutrophils of healthy controls and patients, measured with flow cytometry; representative scatter dot plot (left) and statistical analysis (right, medians, Mann–Whitney test). (I) CD74 (Li) surface expression on human neutrophils of healthy controls and patients, measured with flow cytometry. Medians, Mann–Whitney test. (J) Co-stimulatory factors of healthy controls and patients, measured with flow cytometry. Medians, Mann–Whitney test. For (A, G, F), sepsis patient samples are marked in red. MFI, mean fluorescence intensity. * P ≤ 0.05; ** P ≤ 0.01, *** P ≤ 0.001, **** P ≤ 0.0001.

