Figure 2.
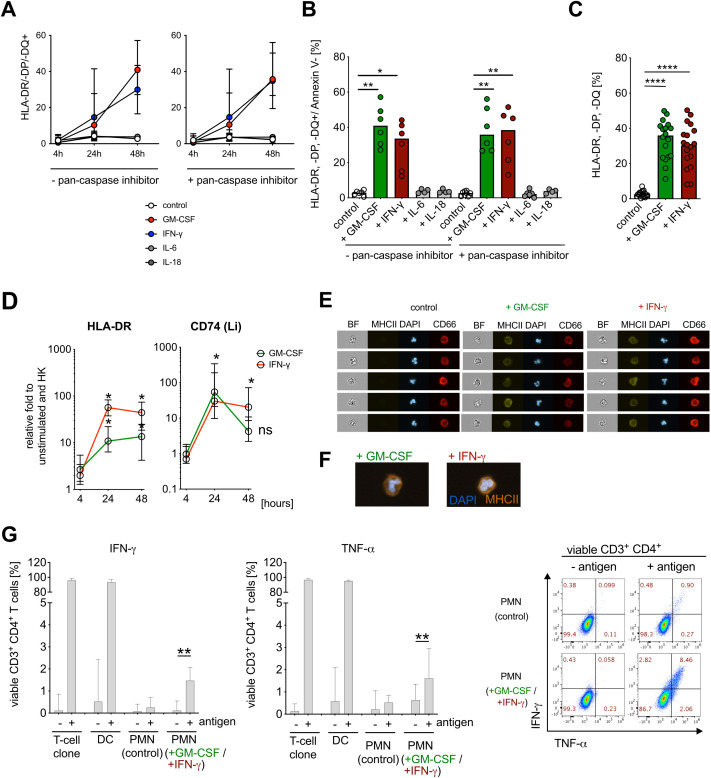
IFN-γ and GM-CSF induce APC-like neutrophil phenotype in vitro. (A) HLA-DR/-DP/-DQ (MHC class II) surface expression on human neutrophils (CD66b+ cells, gated on Annexin V−) after stimulation with human recombinant GM-CSF (10 ng/ml), IFN-γ (10 ng/ml), IL-6 (10 ng/ml) and IL-18 (10 ng/ml) for 48 h, preincubated −/+ pan-caspase inhibitor q.OPh (3 µM) for 4 h, 24 h, and 48 h, measured consequently with flow cytometry, medians with range (n=6). (B) Summary of HLA-DR/-DP/-DQ+/Annexin V− neutrophils after pre-incubation with −/+ q.OPH and stimulation with GM-CSF, IFN-γ, IL-6, and IL-18 for 48h. Medians, Kruskal–Wallis test (compared with controls). (C) Percentage of HLA-DR/-DP/-DQ+/Annexin V− neutrophils after pre-incubation with q.OPh and stimulation with GM-CSF and IFN-γ for 48h. Medians (n=18), Mann–Whitney test. (D) HLA-DR and Li (CD74) mRNA expression after stimulation with GM-CSF and IFN-γ for 4 h, 24 h, and 48h. Values are shown as relative fold change to unstimulated control and internal control (housekeeping genes, HK) (medians, n=6, Mann–Whitney test; ns, not significant). (E) de novo MHC class II (HLA-DR/-DP/-DQ) surface molecule expression on neutrophils after stimulation with GM-CSF and IFN-γ for 48 h, measured with ImageStreamX, representative example. DAPI was used for nuclear staining and CD66b as a surface expression marker. BF, bright field. (F) Representative overlay of de novo MHC class II (HLA-DR/-DP/-DQ, orange) surface molecule expression on neutrophils after stimulation with GM-CSF and IFN-γ for 48 h, measured by ImageStreamX at 60× magnification. DAPI (blue) was used for nuclear staining and CD66b as a surface expression marker. (G) Intracellular cytokine staining for IFN-γ- and TNF-α-positive viable CD3+ CD4+ T cells, co-incubated with PMN or antigen-pulsed PMN [PMN (control), ratio 1:10], and cytokine-stimulated PMN [GM-CSF (10 ng/ml) + IFN-γ (10 ng/ml)] or antigen-pulsed cytokine-stimulated PMN (ratio 1:10) for 6h. Percentage for IFN-γ and TNF-α expression (left), and representative scatter dot plot (right). As a positive control, autologous dendritic cells (DCs, 1:1 ratio) and T-cell clones alone were used. All values are shown as medians with interquartile ranges (n=11; n=6 for positive control with DCs; Wilcoxon signed rank test; * P ≤ 0.05; ** P ≤ 0.01, **** P ≤ 0.0001; ns, not significant.

