Figure 1.
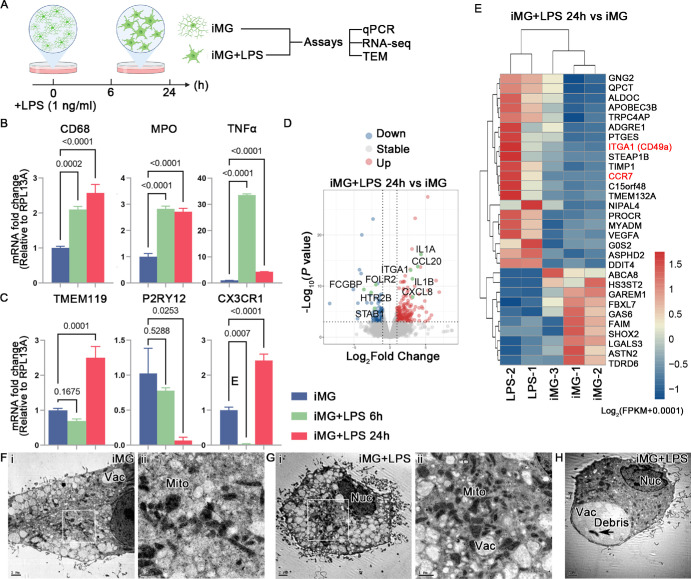
LPS-triggered transcriptional response in iMG. (A) Schematic of LPS treatment and sample collection for subsequent analysis. Created with www.biorender.com. Quantitative PCR analysis for the expression of activated (B) and homeostasis (C) microglial markers. Data are represented as means ± SD; n = 3. (D) Volcano plot shows DEGs in iMG after low concentration of LPS treatment. (E) Heatmap visualization of the normalized gene expression levels for DEGs after LPS treatment for 24 hours. (F–H) Representative TEM images of iMG and LPS-treated iMG after 24 hours treatment. Nuc, nuclear, Vac, vacuole, Mito, mitochondria. Scale bar: 2 µm (F-i, G-i, H). Scale bar: 1 µm (G-ii). Scale bar: 0.5 µm (F-ii).

