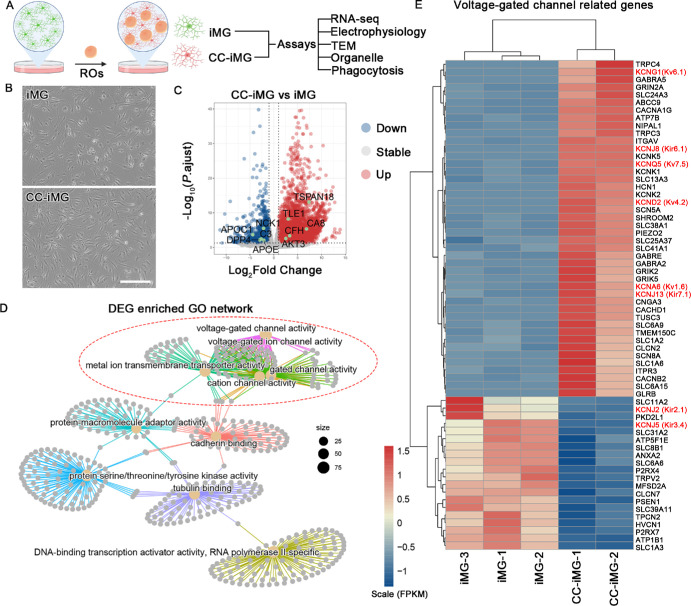
Figure 4.
Transcriptomic changes of iMG after coculture with retinal organoids. (A) Experimental design. Retinal organoids at differentiation days 40-70 were switched to dishes containing iMG at differentiation day 7 and maintained for five days becoming CC-iMG. iMG cultured in the same medium without organoids were designated as control. IMG and CC-iMG were subjected to RNA-seq, electrophysiology, TEM, organelle, and phagocytosis analysis. Created with www.biorender.com. (B) The phage contact photograph of iMG and CC-iMG. Scale bar: 300 µm. (C) Volcano plot shows DEGs in iMG after coculture with retinal organoids. (D) GO term network analysis of DEG. (E) Heatmap visualization of the normalized gene expression levels for DEG related to voltage-gated channels.

