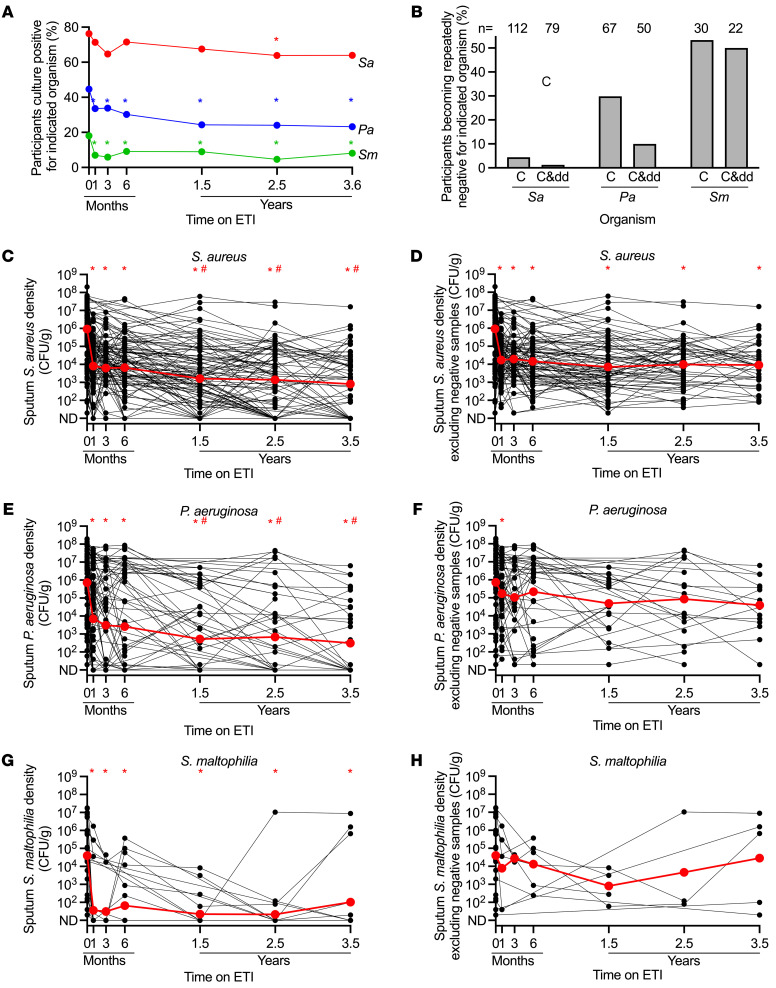
Figure 1. Sputum microbiology after ETI.
(A) Proportion of participants culture positive for indicated pathogens (includes participants missing data at visit). *P < 0.05 by McNemar’s exact test. (B) Proportion of baseline-positive participants becoming repeatedly negative for indicated pathogen by culture (C) or culture and ddPCR (C&dd); n = number of participants analyzed. (C–H) Culture density in participants who were baseline culture positive for indicated pathogens including (C, E, and G) and not including (D, F, and H) culture-negative samples. Similar differences were apparent between all-data vs. data with culture-negative samples eliminated in by-participant averages (Supplemental Figure 1, C–H). Individual participants are indicated in black, averages in red. The limit of detection = 20 CFU/g. *P < 0.05 vs. baseline; #P < 0.05 vs. 1 month by mixed-effects analysis (C–H).

