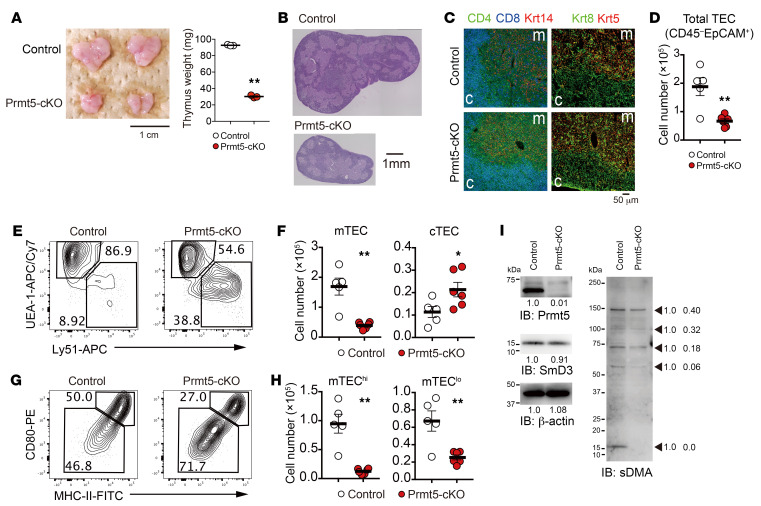
Figure 1. TEC-specific Prmt5 deficiency impairs mTEC development.
(A) Representative photograph of thymi from 4-week-old control (Prmt5fl/fl) and Prmt5-cKO (Prmt5fl/fl Foxn1-Cre) mice and thymic weight. Scale bar: 1 cm. (B and C) Thymic sections from 4-week-old mice were stained with H&E (B) or CD4 (green), CD8 (blue), keratin 14 (Krt14, red), keratin 8 (Krt8, green, and keratin 5 (Krt5, red). (C). The data shown represent 2 independent experiments. Scale bars: 1 mm (B) and 50 μm (C). c, cortex; m, medulla. (D) Number of CD45–EpCAM+ TECs (cells per thymus lobe) from 4- to 5-week-old control mice (n = 5) and Prmt5-cKO mice (n = 6). Each circle indicates 1 mouse. (E and F) Flow cytometric analysis of UEA-1 and Ly51 expression on gated TECs (CD45–EpCAM+) from the indicated mice (E). Graphs depict the number of cTECs (Ly51+) and mTECs (UEA-1+) (F). (G and H) Flow cytometric analysis of CD80 and MHC-II expression on gated mTECs (CD45EpCAM+UEA-1+) (G). Graphs depict the number of CD80hiMHC-IIhi mTECs (mTEChi cells) and CD80loMHC-IIlo mTECs (mTEClo cells) (H). (I) Isolated total mTECs (EpCAM+CD45–UEA-1+Ly51–) from control mice and Prmt5-cKO mice were subjected to SDS-PAGE (1.0 × 10⁵ cell equivalents per lane) followed by immunoblotting with antibodies against Prmt5, SmD3, symmetric dimethyl-arginine (sDMA), and β-actin. Two independent experiments were performed. The arrows indicate the proteins with symmetrically dimethylated arginines. Numbers below the bands and beside the arrow indicate the relative intensity of each band, measured with ImageJ. *P < 0.5 and **P < 0.01, by 2-tailed Student’s t test (A, D, F, and H).

