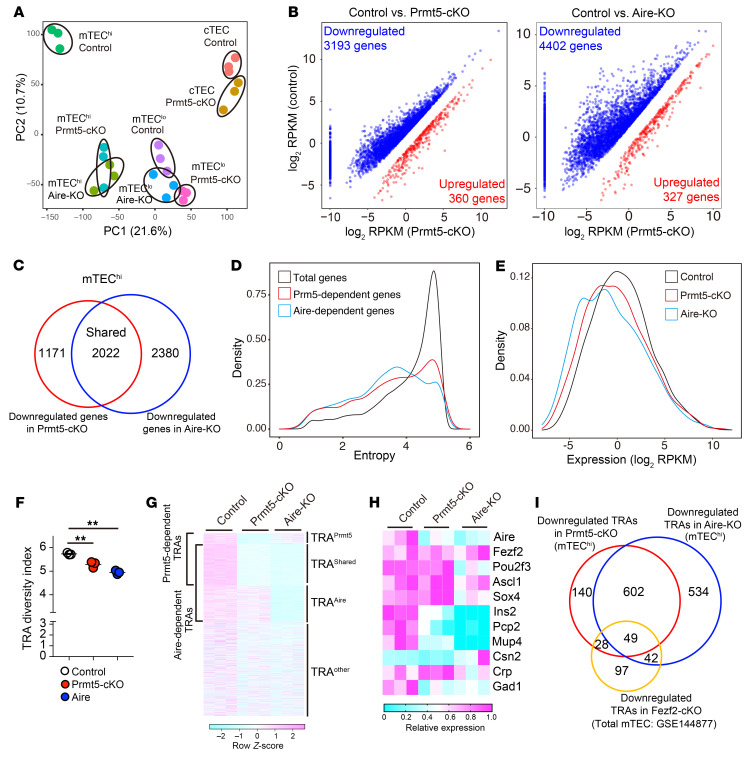
Figure 3. Transcriptome analysis of Prmt5-deficient mTECs.
(A) PCA of RNA-Seq data. The indicated TEC subsets isolated from control mice (Prmt5fl/fl, n = 3), Prmt5-cKO mice (Prmt5fl/fl Foxn1-Cre, n = 3), and Aire-KO mice (n = 3) were subjected to RNA-Seq analysis. The percentages on each axis indicate the variance contribution. (B) Scatter plots of differentially expressed genes (P < 0.05, and fold change >2 [red] or <0.5 [blue]) in Prmt5-deficient or Aire-deficient mTEChi cells. Data represent the mean of log2(reads per kilobase of exon per million mapped reads [RPKM]). Significance was determined using the unpaired, 2-tailed Student’s t test. (C) Venn diagram showing the overlap between the set of genes significantly downregulated in Prmt5-deficient mTEChi cells and Aire-deficient mTEChi cells. (D) Density plot showing the entropy score of individual genes expressed in mTEChi cells. The total genes expressed in mTEChi cells (mean of RPKM >0 in control mTEChi cells, 19,324 genes: black line), genes downregulated (P < 0.05, fold change <0.5) in Prmt5-deficient mTEChi cells (2,652 genes: red line), and genes downregulated (P < 0.05, fold change <0.5) in Aire-deficient mTEChi cells (3,677 genes: blue line). (E) Density plot showing gene expression of total TRAs (entropy score <3.0) in mTEChi cells from control mice (black), Prmt5-cKO mice (red), and Aire-KO mice (blue). (F) The diversity index of the TRAs (entropy score <3.0) expressed in mTEChi cells was evaluated using the Shannon-Weaver model. **P < 0.01, by 1-way ANOVA followed by Dunnett’s multiple-comparison test. (G) Expression heatmap of total TRA genes in mTEChi cells (entropy score <3.0). (H) Relative expression of representative transcriptional factors and TRAs in mTEChi cells shown as a heatmap. (I) Venn diagram showing the overlap between a set of TRA genes under the control of Prmt5, Aire, and Fezf2 (GSE144877).

