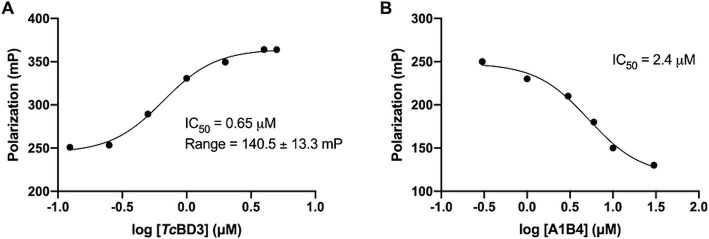
Figure 2.
(A) Binding of TcBDF3 to BSP-Alexa 488. An increasing amount of TcBDF3 protein was added to 1 mM of BSP-Alexa 488. Fluorescence polarization was measured at room temperature. Data was analyzed in GraphPad Prism 9.0 by fitting mP data using a sigmoidal dose–response non-linear regression curve. (B) A1B4 was titrated against a constant concentration of BSP-Alexa-488 (0.5 mM) in the presence of 100-μM TcBDF3. Data was analyzed in GraphPad Prism 9.0 by fitting mP data using a sigmoidal dose–response non-linear regression curve.

