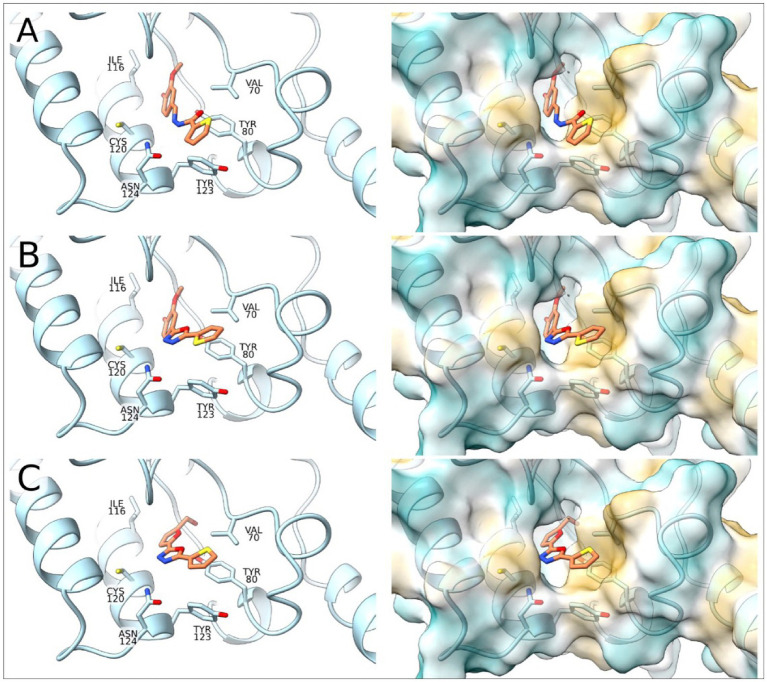
Figure 4.
Molecular docking of TcBDF3-ligand structures obtained from molecular dynamics simulations. In the left panel, the C atoms of the ligands are shown in orange and the C atoms of TcBDF3 are in light blue. O atoms are colored in red, N atoms in blue, and S atoms in yellow. In the right panel, TcBDF3 is represented as a surface and the ligands are depicted in liquorice format. (A) A1B4, (B) A1B4c, and (C) A5B4c.

