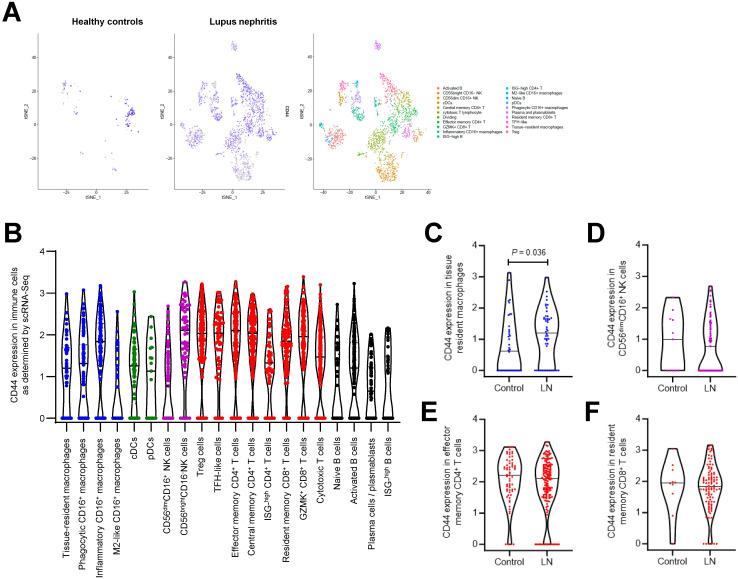
Figure 2.
CD44 expression in immune cells in LN patients. (A) tSNE plots showing CD44 gene expression in immune cells using public scRNA-Seq dataset obtained from kidney specimens from 24 LN patients and 10 healthy controls (34). (B) Violin plots showing CD44 gene expression in different subsets of macrophages, dendritic cells, T cells and B cells in LN patients. Violin plots showing CD44 expression in (C) tissue resident macrophages (D) CD56dimCD16+ NK cells, (E) effector memory CD4+ T cells and (F) resident memory CD8+ T cells in 10 healthy controls and 24 LN patients. Each dot represents a single cell. Horizontal line represents mean value for each group.

