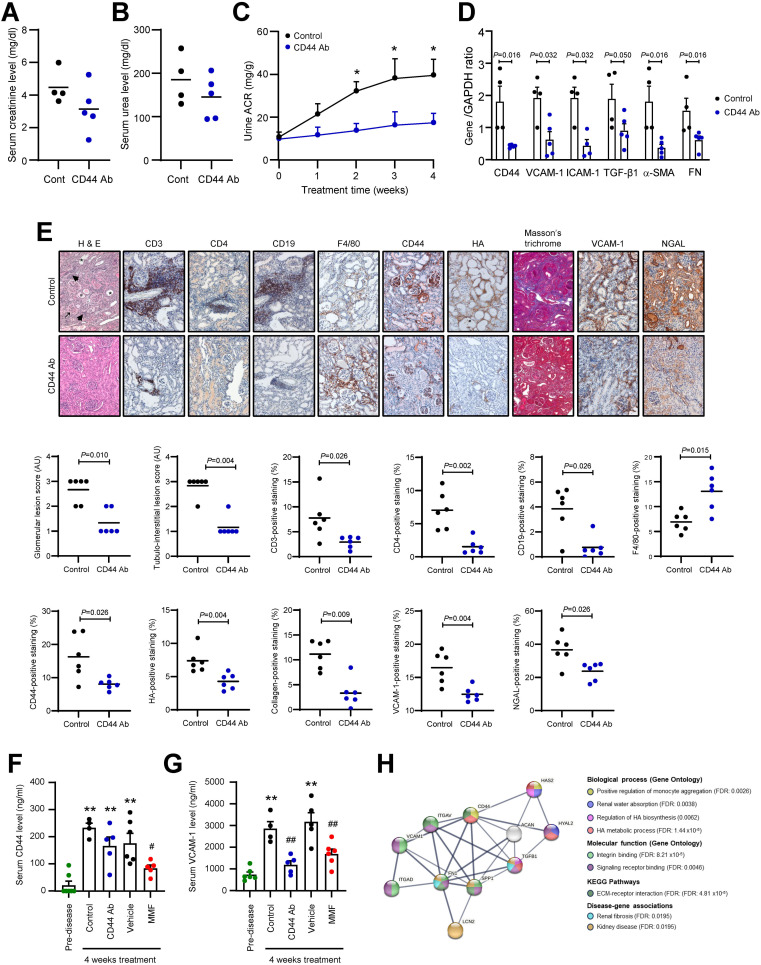
Figure 4.
Effect of anti-CD44 antibody on clinical, serological and histological parameters of disease in NZB/W F1 Mice. Serum (A) creatinine and (B) urea levels in NZB/W F1 mice treated with either Control IgG (Cont, n = 4) or anti-CD44 antibody (CD44 Ab, n = 5) for 4 weeks. (C) Urine albumin-to-creatinine ratio (ACR) determined weekly from commencement of study to study’s end for mice treated with Control IgG (n = 4) or anti-CD44 antibody (n = 5). *P<0.05, Control IgG vs anti-CD44 antibody for the same time-point. (D) Gene expression of CD44, VCAM-1, ICAM-1, TGF-β1, α-SMA and FN in the renal cortex from NZB/W F1 mice treated with either Control IgG (Control, n = 4) or CD44 Ab (n = 5) for 4 weeks. Each sample was assessed in triplicate by qPCR, normalized to GAPDH and each dot represents the mean value for each mouse. Data analysed using Mann-Whitney test for each gene. (E) Upper panel: representative images showing H & E, CD3, CD4, CD19, F4/80, CD44, HA, collagen (determined by Masson’s trichrome), VCAM-1 and NGAL staining in mice treated with either Control IgG (Control, n = 6) or CD44 Ab (n = 6) for 4 weeks. In H & E image, asterisks depict tubular atrophy, hashtag depicts protein cast formation, arrowhead depicts immune cell infiltration and arrow depicts areas of glomerulosclerosis. Original magnification x200. Lower panels: Glomerular and tubulo-interstitial lesion scores as determined by H & E staining was graded for each mouse as described in the Methods and Materials. Scatterplots showing staining of CD3+ T cells, CD4+ T cells, CD19+ B cells and macrophages as determined by F4/80 staining, and expression of CD44, HA, collagen, VCAM-1 and NGAL as a percentage of the whole image area as assessed by ImageJ software. Horizontal line represents the mean for each group. Data analysed using Mann-Whitney test. (F) Serum CD44 and (G) Serum VCAM-1 levels in NZB/W F1 mice treated with Control IgG (n = 4) or CD44 Ab (n = 5) for 4 weeks. In a parallel study, serum CD44 and VCAM-1 levels were measured in mice treated with vehicle (n = 5) or MMF (n = 6) for 4 weeks. Serum from 8-week old pre-disease mice (n = 6) served as baseline CD44 and VCAM-1 levels. **P<0.01, compared to pre-disease mice, # P<0.05, ## P<0.01, Control vs CD44 Ab, or Vehicle vs MMF. Each dot represents an individual mouse. Data analysed using Kruskal-Wallis test followed by Dunn’s multiple comparison post-test. Mice were 29-32 weeks of age at the time of sacrifice for panels (A–G). Although 6 mice were assigned to Control IgG- and anti-CD44 antibody-treated groups, frozen biological samples from 2 Control IgG-treated mice and 1 anti-CD44 antibody-treated mouse were compromised, and these 3 samples were not used for subsequent clinical (C), serological (A, B, F, G) or mRNA analyses (D). (H) PPI network for CD44, HA, FN (FN1), TGF-β1, VCAM-1 and NGAL (LCN2) constructed using STRING database, with a minimum required interaction score of 0.7 (high confidence). Eleven nodes were identified with 27 edges (PPI enrichment P value 5.56 x10⁻¹⁰). Line thickness indicates confidence level of protein-protein interaction. Coloured nodes show their interaction in various biological processes, molecular functions, KEGG pathways and association with disease. False discovery rates (FDR) are shown. ACAN, aggrecan; HAS2, hyaluronan synthase 2; HYAL2, hyaluronidase-2; ITGAD, integrin αD (receptor for VCAM-1); ITGAV, integrin αV; SPP1, osteopontin (ligand for CD44).

