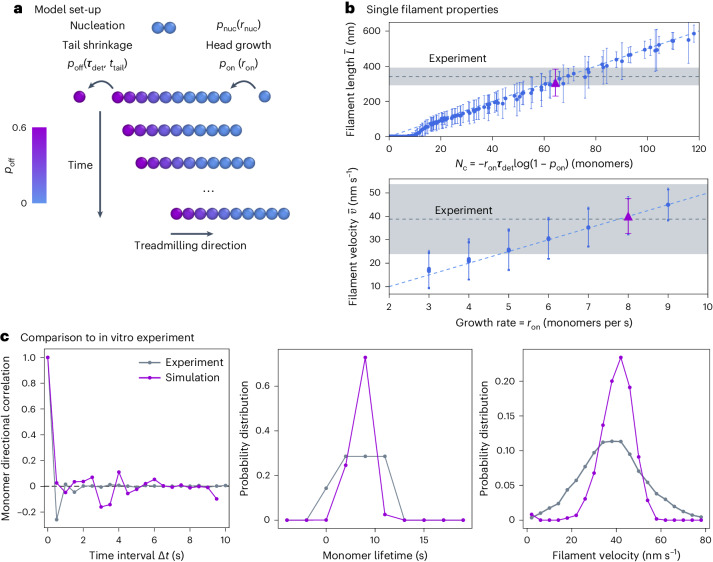
Fig. 1. Coarse-grained model for treadmilling filaments.
a, New filaments nucleate at a constant rate rnuc, grow with probability pon = rondt and shrink with probability poff, determined by the monomer detachment time and the time the monomer has been in the system. This growth and shrinkage dynamics results in the apparent directional motion of the filaments over time. b, Upper, single filament length against the corresponding intrinsic size Nc. The blue dashed line is the theoretical (σ = 5 nm). Lower, average treadmilling velocity of a filament against the corresponding growth rate ron. The blue dashed line is the theoretical . In both graphs, each point is the steady-state average over 20 replicas of single-filament simulations with error bars for the standard error of the average. The grey dashed lines correspond to the fluorescence microscopy experiments of in vitro reconstituted E. coli FtsZ treadmilling filaments on SLBs at 1.25 μM (shaded areas for error). Purple triangles correspond to ron = 8 monomers per second and s, which fit experimental measurements best and are used for the simulation data in c. c, Single-filament dynamics in simulations (in purple) quantitatively matches in vitro FtsZ dynamics (in grey). Left, directional autocorrelation of FtsZ monomers at increasing time intervals Δt decays quickly, showing the static nature of individual monomers. Middle, monomer lifetime distribution. Right, treadmilling filament velocity distribution.

