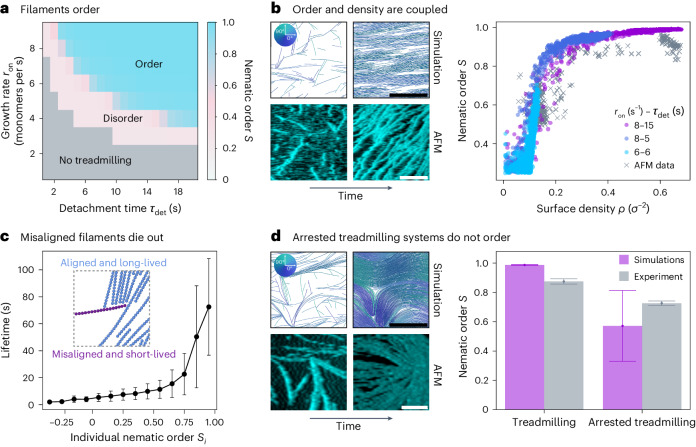
Fig. 2. Collective behaviour of treadmilling filaments.
a, Steady-state nematic order parameter S measured in simulations (average over N = 10 replicas, t > 10 min). Grey indicates the quasi-empty systems of non-treadmilling filaments, blue the nematically ordered system with polar bands and pink the disordered transitional region. b, Left, snapshots of treadmilling systems at early (leftmost column) and late (rightmost column) times in simulations and in HS-AFM experiments (filaments are coloured according to their orientation—see the colour wheel in the inset). Right, nematic order S plotted against surface density ρ at different points in time for reconstituted FtsZ on SLBs (AFM data is shown as crosses) and simulations (coloured according to kinetics and shown as circles). For experiments, data from N = 3 different videos is shown. For simulations, N = 10 different trajectories are shown for each parameter set. c, Filament lifetime for different levels of alignment (characterized by the individual nematic order Si). We consider only simulations for Nc ≥ 100 (N = 10 replicas per parameter set), which results in 226,077 data points (filaments) in total, binned in Si with width 0.1. Points correspond to the mean of the bin and the error bar to the standard deviation. Inset, snapshot of a trapped misaligned filament (purple) that dissolves over time (Supplementary Video 7). d, Left, snapshots of systems with arrested treadmilling at early (leftmost column) and late (rightmost column) times in simulations (same kinetic parameters as in b and in HS-AFM experiments). Right, steady-state nematic order S for treadmilling and non-treadmilling systems. Bars and dots indicate the average for t > 600 s (N = 10 replicas in simulations: n = 600 data points in simulations, n = 28 data points for treadmilling experiments and n = 48 for arrested treadmilling experiments), and error bars indicate the standard deviation. In experiments, ‘treadmilling’ corresponds to wild-type data and ‘arrested treadmilling’ to the L169R mutant. Unless stated otherwise, simulation data corresponds to ron = 8 s−1, and rnuc = 1 s−1 for lp = 10 μm and D = 100 nm2 s−1. Scale bars, 500 nm.

