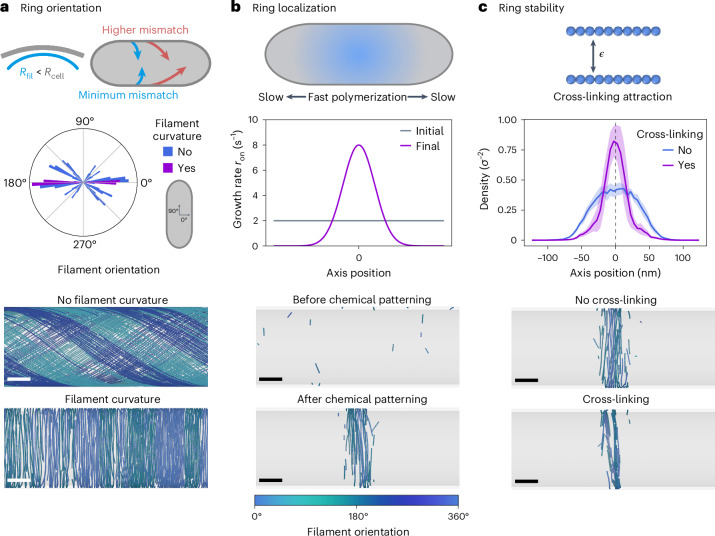
Fig. 3. Formation of the bacterial division ring.
a, Filament curvature and cell geometry drive the collective filament orientation along the cell circumference. Top, illustration of the curvature-sensing mechanism of FtsZ and FtsA filaments. Middle, measured distribution of filament orientations with and without filament curvature. Each bar plot corresponds to the average over N = 10 replicas in the nematic order region of the parameter space (ron = 8 s−1, ). Bottom, two representative snapshots of steady-state configurations of treadmilling filaments with and without filament curvature. b, Spatial modulation of FtsZ's growth and nucleation kinetics mediates its midcell localization. Top, illustration of the typical FtsZ kinetics modulation observed in vivo. Middle, example of a kinetics modulation combining an increase in the growth and nucleation rates around the midcell with a decrease at the poles. Bottom, two representative snapshots of system configurations before and after the modulation of the kinetics is switched on. c, Attractive interactions stabilize the ring and mediate tight packing. Top, illustration of the cross-linking implementation. Middle, late time (t > 8 minutes after the switch) density profiles along the cell axis with and without cross-linking interactions. The solid lines represent the mean over N = 10 replicas and the shaded region, the standard deviation. Bottom, two representative snapshots of steady-state rings with and without cross-linking interactions. In b and c we use switch parameters , and wprof = 100 nm for , where wprof defines the profile width (see Supplementary Information). In all snapshots, the filaments are coloured according to their orientation with respect to the cell circumference (see colour bar at the bottom). For all simulations, we set fcurv = 5kBT/σ, lp = 10 μm and D = 100 nm2 s−1 in a box of size L = 200 σ = 1 μm. Scale bars, 50 nm.

