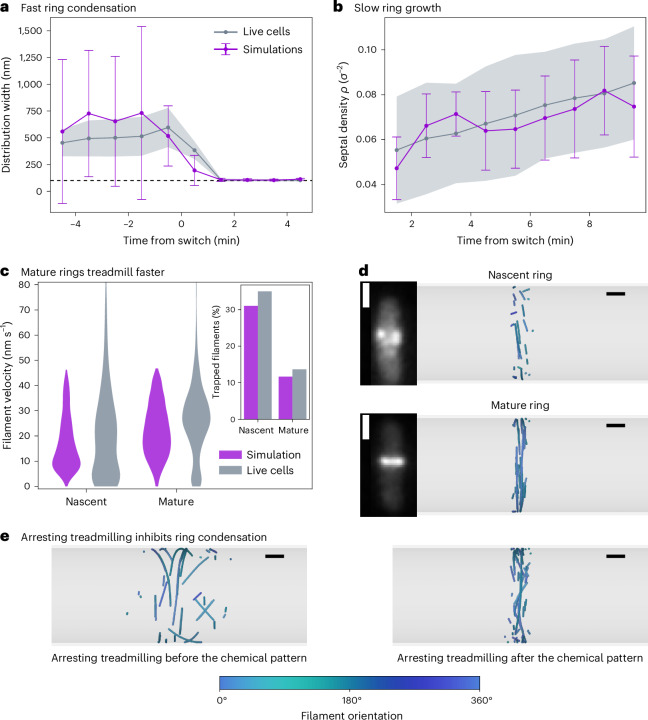
Fig. 4. Z-ring formation in vivo.
a, Z-ring condensation dynamics for live cells (grey) and simulations (purple). A rapid ring collapse around t = 0 minutes is observed. b, Ring density in time for live cells (grey) and simulations (purple). A positive average slope is observed, indicating the slow accumulation of proteins to the division site. In a and b, solid lines correspond to the average over samples (N = 10 replicas for simulations, N = 67 cells analysed from three independently prepared bacterial samples) and the shaded region or error bars to the standard deviation. Time t = 0 corresponds to the onset of the chemical pattern. c, Filament velocity distributions in nascent and mature rings for live cells (grey) and simulations (purple). Inset, fraction of trapped filaments (v < 10 nm s−1) for each distribution. In simulations we define t < 2 min for nascent and t > 8 min for mature rings. Statistics are done over n = 1,834 data points (filaments) for simulated nascent rings, n = 2,347 data points (filaments) for simulated mature rings, n = 1,066 data points for nascent in vivo rings and n = 3,126 data points for mature in vivo rings (note that this is the number of filaments imaged but the number of cells is N = 67 biological replicates). d, Representative snapshots of two successive ring configurations observed in vivo and in simulations. Microscopy images show fluorescently tagged FtsZ in live B. subtilis cells. These experiments were repeated independently with similar results. Simulations were repeated for N = 10 replicas with similar results. e, Representative snapshots of systems at t = 10 min after arresting treadmilling. Treadmilling is arrested 5 min before (left) and 1 min after (right) the onset of the chemical pattern that modulates the growth kinetics. The simulation data in a, b and c correspond to a switch with parameters , and for and wprof = 100 nm. Note that monomers in simulations are rendered with size 20 nm instead of the actual 5 nm for visualization purposes and are coloured according to their orientation with respect to the cell circumference (see the colour bar at the bottom). Scale bars, 1 μm (d, insets), 200 nm (d,e).

