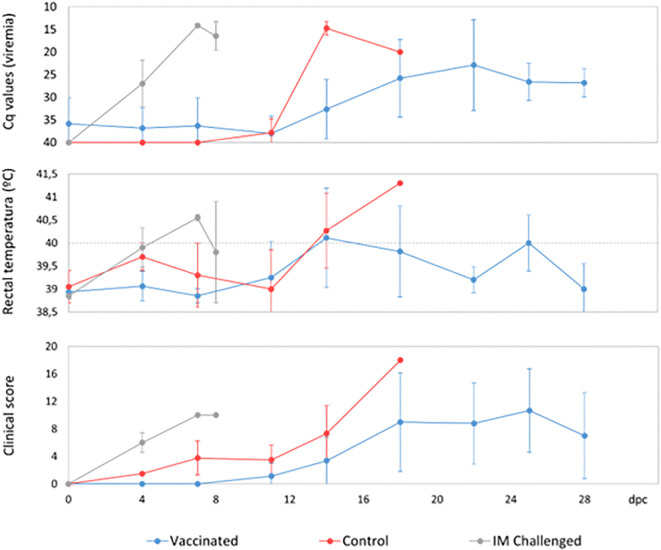
Figure 3.
Heat map of Cq values from real-time PCR of blood samples from wild boar. Each row represents an individual animal, and each column represents a time point. The heat map indicates the Cq values for each animal, with color intensity reflecting the magnitude of the values. Animals were either orally vaccinated with ASFV Lv17/WB/Rie1 or were naïve (control), and all were challenged by direct contact with animals intramuscularly inoculated with ASFV Ken06.Bus (IM-challenged). The status of each animal is indicated for better clarity and comparison.

