
FIGURE 3.
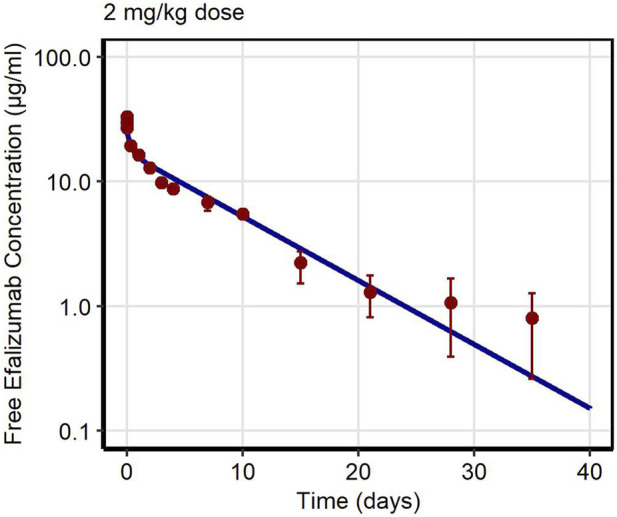
Free efalizumab concentrations over time in rabbit. Line: Simulation, points: observed data (Mould and Green, 2010).
Official websites use .gov
A
.gov website belongs to an official
government organization in the United States.
Secure .gov websites use HTTPS
A lock (
) or https:// means you've safely
connected to the .gov website. Share sensitive
information only on official, secure websites.
Free efalizumab concentrations over time in rabbit. Line: Simulation, points: observed data (Mould and Green, 2010).