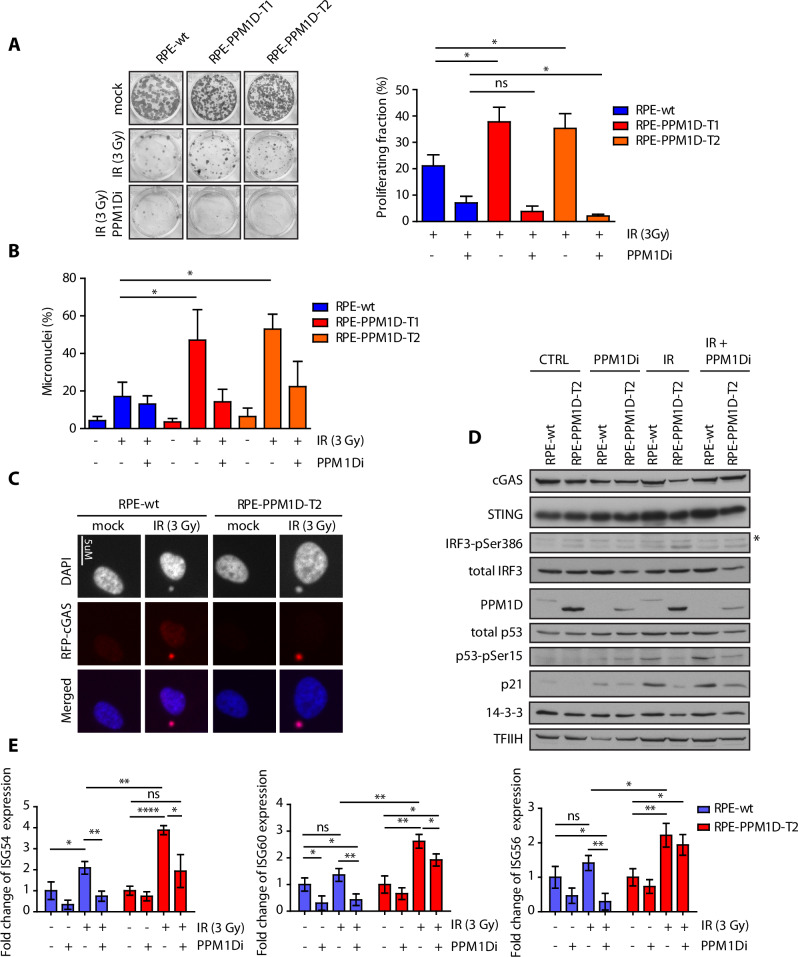
Fig. 1. Cells carrying the truncated PPM1D form micronuclei after exposure to ionising radiation.
A Parental RPE, RPE-PPM1D-T1 and RPE-PPM1D-T2 cells were mock treated or irradiated (3 Gy) in the presence or absence of PPM1Di and further cultured for 10 d. Surviving fraction was calculated by normalising the colony number to the non-treated control for each genotype. Error bars indicate SD. Statistical significance was determined by Student’s t test (*p ≤ 0.05, n = 3). B Parental RPE, RPE-PPM1D-T1 and RPE-PPM1D-T2 cells were mock treated or irradiated (3 Gy) in presence or absence of PPM1Di and fixed after 48 h. Cells were then stained with DAPI and percentage of cells containing micronuclei was determined microscopically. More than 200 cells per condition were quantified in each experiment (n = 3), error bars indicate SD. Statistical significance was determined by Student’s t test (*p ≤ 0.05) C Parental RPE and RPE-PPM1D-T2 cells were stably transfected RFP-cGAS and were fixed 48 h after mock treatment or irradiation (3 Gy). Note accumulation of RFP-cGAS in MNs in cells exposed to IR. D Parental RPE and RPE-PPM1D-T2 stably transfected with RFP-cGAS were mock treated or irradiated (3 Gy) in presence or absence of PPM1Di. Whole cell lysates were collected after 48 h and analysed by immunoblotting. Asterisk indicates a non-specific reactivity. Signal of IRF3-pSer386 was quantified in ImageJ from 3 independent repeats and was normalised to the loading control (TFIIH) and to the non-treated condition. Statistical significance was determined by Student’s t test (*p ≤ 0.05, n = 3, error bars indicate SD). E RNA was collected from cells grown as in (D) and expression of indicated genes was analysed by qPCR. Statistical significance was calculated by Student’s t test (*p ≤ 0.05, **p ≤ 0.01, ****p ≤ 0.0001).

