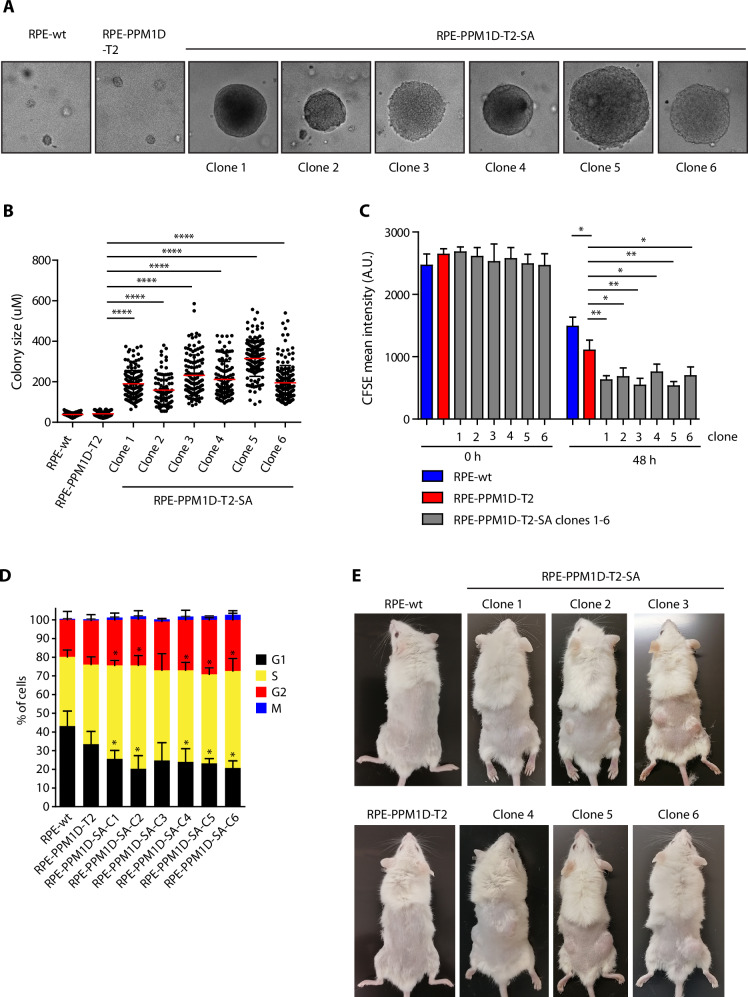
Fig. 2. PPM1D activity promotes cell transformation after exposure to ionising radiation.
A Parental RPE and RPE-PPM1D-T2 cells were mock treated or irradiated (3 Gy) and were grown in semi-solid media for 12 weeks. Six independent clones of RPE-PPM1D-T2-SA cells were collected. B Colony size of parental RPE cells, parental RPE-PPM1D-T2 cells and transformed RPE-PPM1D-T2 clones was acquired after propagating in the semisolid media for 2 weeks. Each dot represents a single colony, red line indicates mean colony size, bars show SD, n = 2. C Cell division was monitored by labelling of cells with CFSE. A zero time point was collected to determine the initial labelling and the rest of the samples were collected after 48 h. Cell were then collected and fixed and analysed by FACS. Plotted is the mean intensity of CFSE signal, error bars indicate SD, n = 3. Statistical significance was calculated using Student’s t test (*p ≤ 0.05, **p ≤ 0.01). D Cell cycle distribution was determined in parental RPE, parental RPE-PPM1D-T2 cells and transformed RPE-PPM1D-T2 clones using flow cytometry. Plotted are fractions of cells in G1, S, G2 and M phases of the cell cycle. Error bars indicate SDs, n = 3. E Nude mice were subcutaneously injected with parental RPE cells, parental RPE-PPM1D-T2 cells and transformed RPE-PPM1D-T2 clones and tumour growth was evaluated after 3 weeks.

