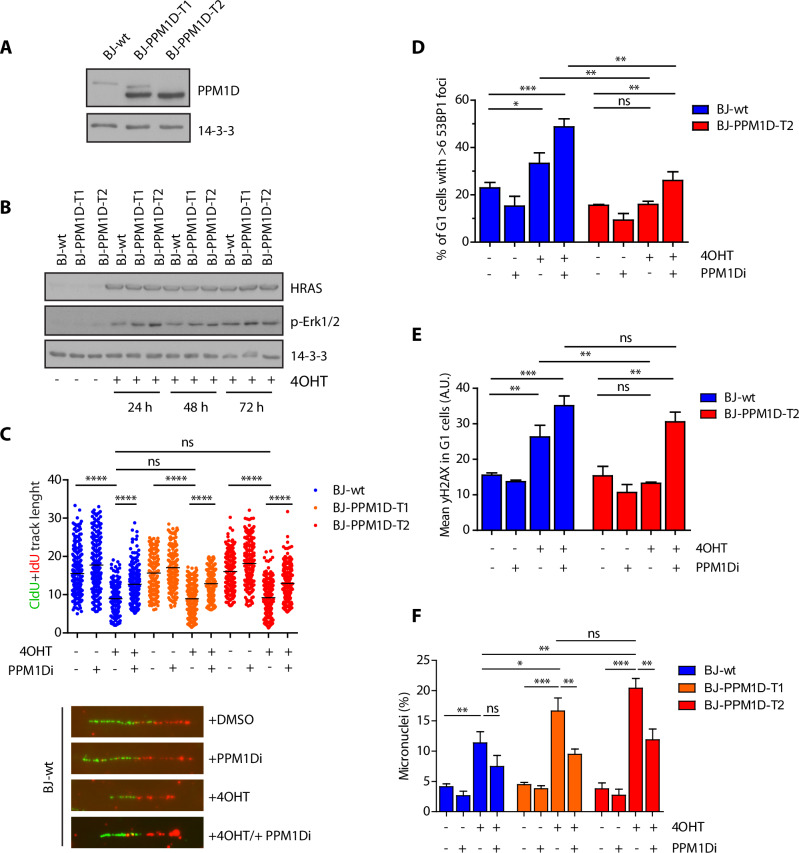
Fig. 4. Impact of PPM1D activity on RAS-induced replication stress.
A BJ-hTert-HRASV12ER-TAM and two clones expanded after targeting the exon 6 of PPM1D by CRISPR/Cas9 were analysed by immunoblotting. Staining for actin was used as loading control. B BJ-hTert-HRASV12ER-TAM, BJ-hTert-HRASV12ER-TAM-PPM1D-T1 and BJ-hTert-HRASV12ER-TAM-PPM1D-T2 cells were induced with 4OHT for indicated times and whole cell lysates were analysed by immunoblotting. Staining for 14-3-3 protein was used as loading control. C BJ-hTert-HRASV12ER-TAM, BJ-hTert-HRASV12ER-TAM-PPM1D-T1 and BJ-hTert-HRASV12ER-TAM-PPM1D-T2 were induced with 4OHT for 2 d and were labelled with CldU and IdU 20 min. Plotted is the sum of the length (μm) of CldU and IdU labelled tracks, each dot represents one replication fork, n = 3. Black line indicates mean. Statistical significance was calculated by Student’s t test (****p ≤ 0.0001). D BJ-hTert-HRASV12ER-TAM and BJ-hTert-HRASV12ER-TAM-PPM1D-T2 cells were induced with 4OHT for 5 d and formation of 53BP1 nuclear foci was evaluated by ScanR microscopy. Plotted is a fraction of cells with ≥6 53BP1 nuclear foci. More than 300 cells were quantified per experiment, bars indicate SD, n = 3. Statistical significance was calculated by Student’s t test (*p ≤ 0.05, **p ≤ 0.01, ***p ≤ 0.001). E Cells from (D) were probed for γH2AX and analyzed by ScanR microscopy. Plotted is mean nuclear signal of γH2AX in G1 cells. Statistical significance was calculated by Student’s t test (**p ≤ 0.01, ***p ≤ 0.001). F BJ-hTert-HRASV12ER-TAM, BJ-hTert-HRASV12ER-TAM-PPM1D-T1 and BJ-hTert-HRASV12ER-TAM-PPM1D-T2 induced with 4OHT for 5 d. Fraction of cells containing MN was determined microscopically. Bars indicate SD, more than 150 cells per condition were quantified in each experiment, n = 3. Statistical significance was calculated by Student’s t test (ns p > 0.05; *p ≤ 0.05, **p ≤ 0.01, ***p ≤ 0.001).

