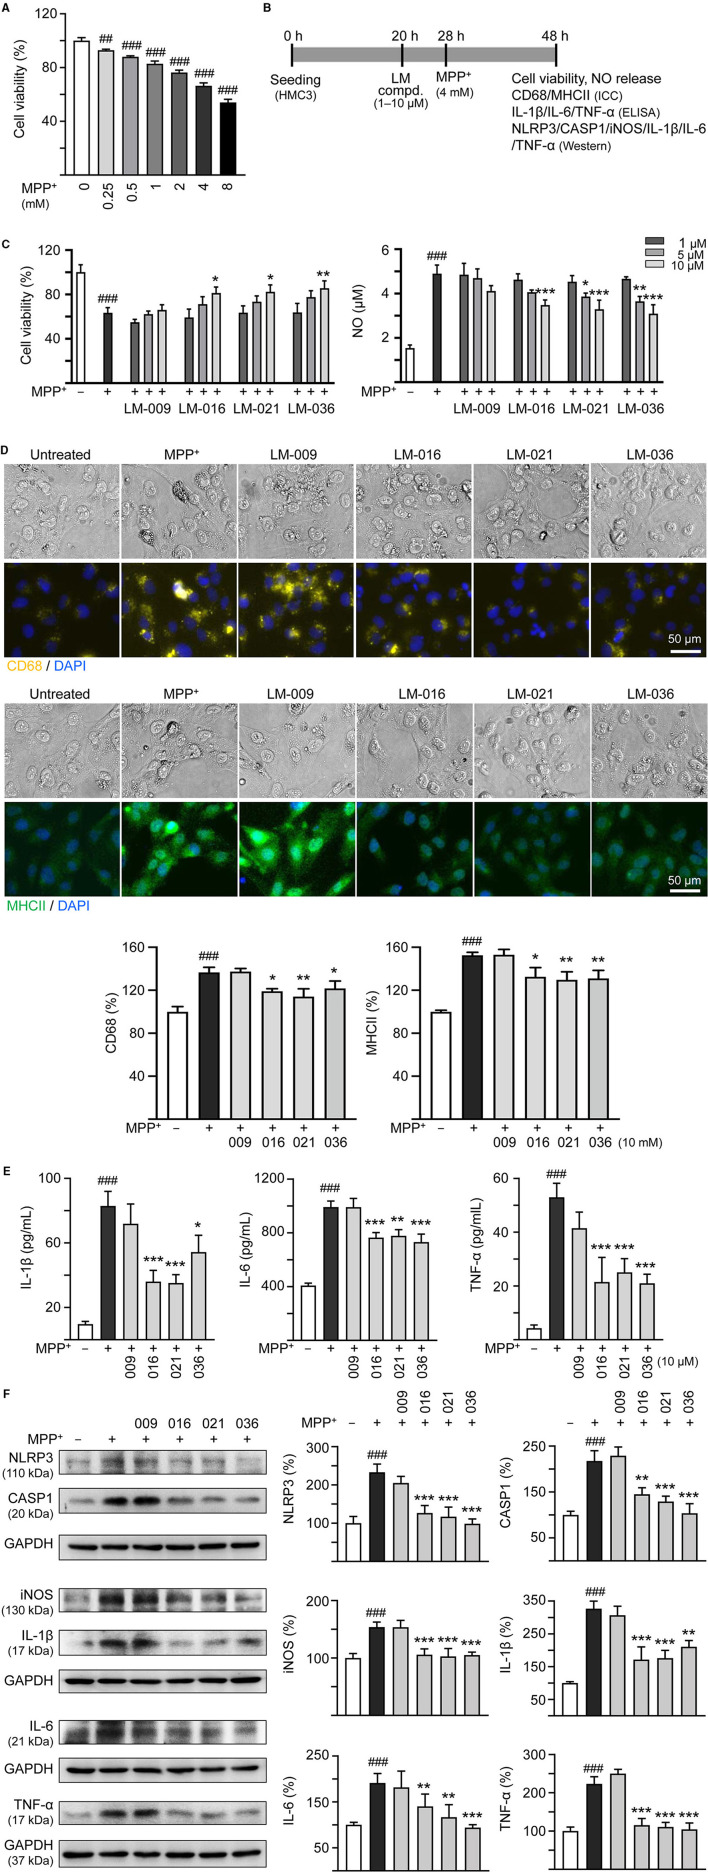
Figure 2.
MPP+ induced inflammation of HMC3 microglia and anti-inflammatory potential of LM compounds. (A) Cytotoxicity of MPP+ against HMC3 cells by MTT assay. Cells were treated with MPP+ (0–8 mM) and cell viability was measured the following day (n = 3). (B) Experimental flow chart of anti-inflammatory test. HMC3 cells were plated on day 1. After 20 h, cells were pre-treated with LM compounds (1–10 μM) for 8 h, followed by MPP+ (4 mM) treatment for 20 h. On day 3, the HMC3 cells were examined for cell viability and NO release in culture medium (C). In addition, cells with 10 μM compound treatment were examined for CD68 and MHCII expression by ICC staining (D), IL-1β, IL-6, and TNF-α in culture medium by ELISA (E), and NLRP3, CASP1, iNOS, IL-1β, IL-6, and TNF-α expression by Western blotting (F) (n = 3). The relative cell viability as well as CD68, MHCII, NLRP3, CASP1, iNOS, IL-1β, IL-6, and TNF-α expression levels in MPP+-untreated cells were normalized as 100%. In CD68 (yellow) and MHCII (green) staining cells, nuclei were counterstained with DAPI (blue). GAPDH was used as a loading control in immunoblotting. p-values: comparisons between MPP+-untreated and treated cells (##p < 0.01, ###p < 0.001), or with and without compound addition (*p < 0.05, **p < 0.01, ***p < 0.001).

