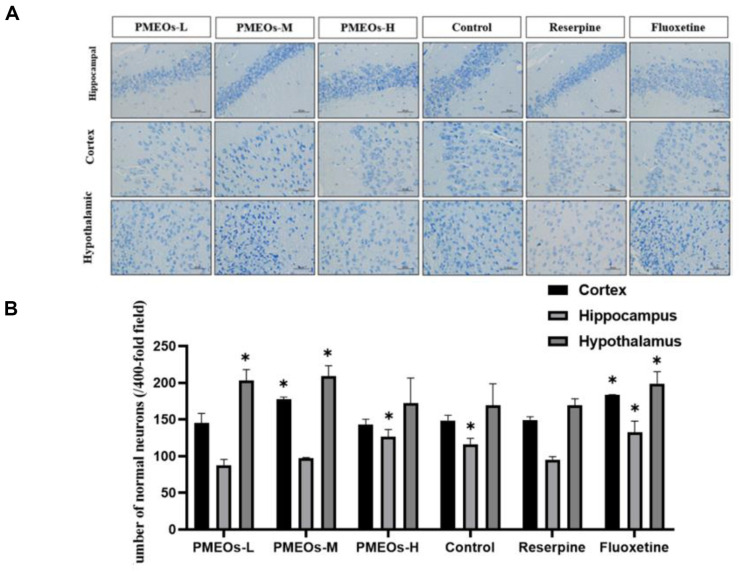
Fig. 4. (A) Nissl staining intact cell morphology and effect of PMEOs on Nissl body numbers in hippocampus, cortex and hypothalamus. (B) Nissl-stained neuron cells in the hippocampus, cortex and hypothalamus.
Quantification of Nissl bodies in the hippocampus, cortex, and hypothalamus using an image analyzer. IOD integrated optical density. The values are shown as mean ± SEM (n = 10). The significance of differences from the Reserpine group is at *p < 0.05 and **p<0.01. (Original magnification × 400, scale bar = 50 μm)

