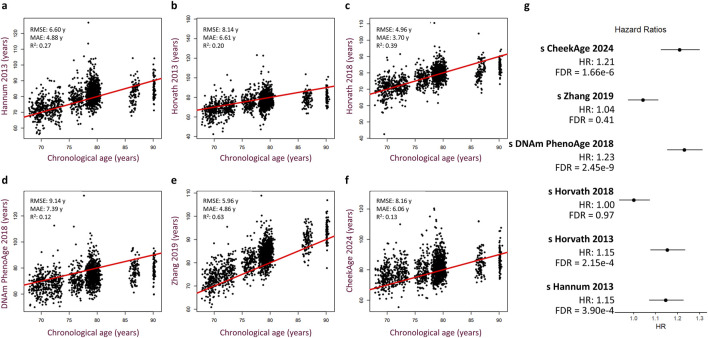
FIGURE 3.
Performance of other published epigenetic age clocks in the Lothian Birth Cohorts. (A–F) Scatterplots showing predicted age versus chronological age and best fit linear regression lines for the Hannum 2013 (A), Horvath 2013 (B), Horvath 2018 (C), DNAm PhenoAge 2018 (D), Zhang 2019 (E), and CheekAge 2024 (F) clocks. Root mean squared error (RMSE), mean absolute error (MAE), and squared Pearson correlation coefficient (R2) values are shown for each clock. (G) Hazard ratios with 95% CI and FDR values are shown for each clock. Cox regression models include delta age, chronological age, timepoint, cohort, sex, and cell type composition as covariates.

