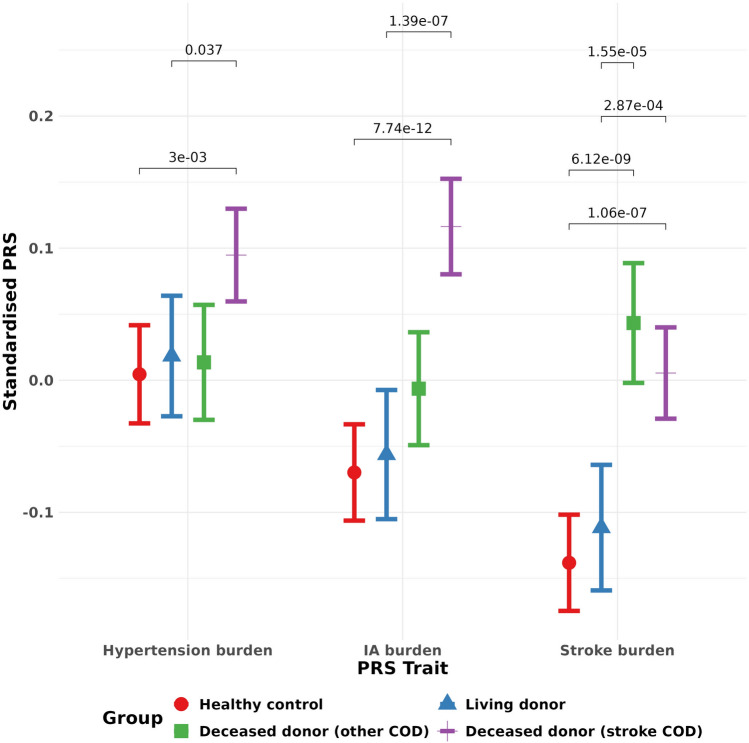
Fig. 1.
Cerebrovascular polygenic burden across donor type and controls. Mean value for each cerebrovascular polygenic risk score is given (along with 95% CI) for each donor type and the healthy controls. Bonferroni-adjusted p-value significance levels comparing the mean values in each group are above the error bars. Living donors have similar levels of polygenic burden to healthy controls. Deceased donors who died of stroke have elevated polygenic burden for each trait compared to healthy controls. Deceased donors who died of other causes appear to have slightly higher polygenic burden for each trait compared to healthy controls, but still lower than donors who died of stroke

