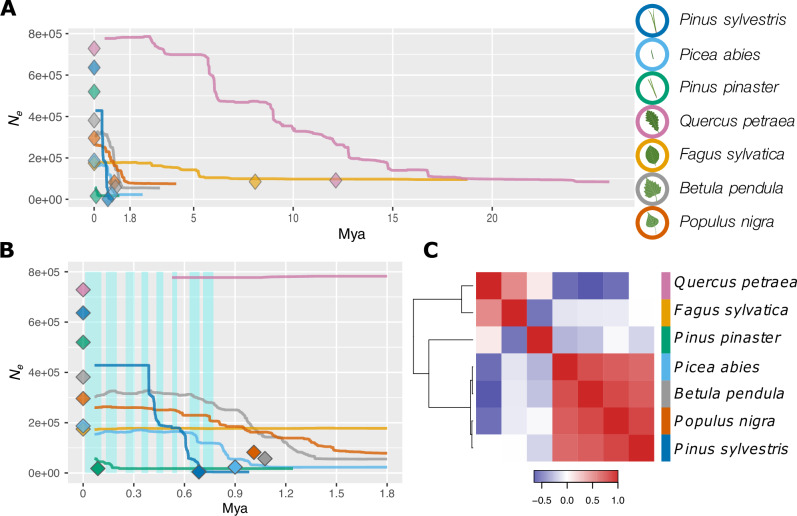
Fig. 3. Demographic change across time for the seven tree species.
A Change in effective population size (Ne) through time (million years ago, Mya), inferred with Stairway Plot 2 (lines, one-sample-per-population dataset; see Supplementary Data 7) or with fastsimcoal2 (diamonds, 2-epoch model and one-sample-per-population dataset; see Supplementary Data 5 and 6). The median changes in Ne are reported from both methods. B A zoom-in of (A) focusing on the 0–1.8 Mya period. Blue shaded rectangles delineate glacial periods. Timing of the glacial periods was inferred from composite CO2 records publicly available at (https://www.ncei.noaa.gov/). C Heatmap based on Kendall’s correlation coefficients computed from changes in Ne through time between each pair of species. The order of species along the x-axis is the same as that along the y-axis. Blue and red colors represent negative and positive correlation values, respectively. Source data are provided as a Source Data file-1.

