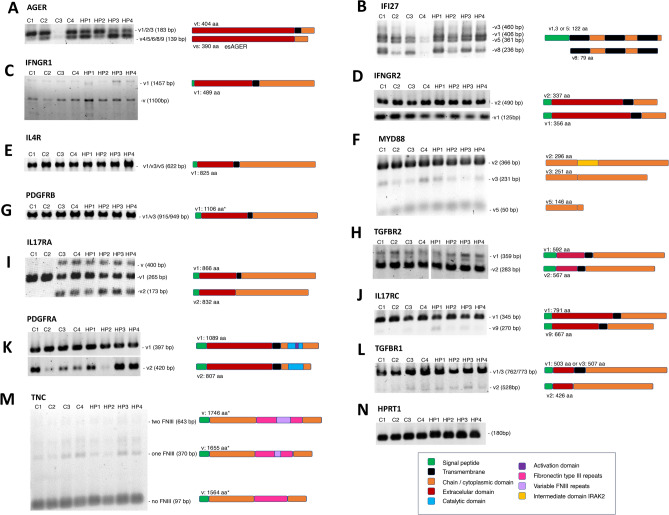
Fig. 2.
Distinctive pattern of gene isoforms in HP lung fibroblasts. Alternative variants of selected genes were analyzed by end-point PCR. The splicing PCR products were resolved in 2% agarose-TBE (A-M). The expected size for each variant (V) is indicated on the right side of the gels. A schematic representation of the protein corresponding to each transcript is also included at the side. * Predicted size of complete protein. (N) HPRT amplification was used to verify the quality and loading quantities of used cDNAs. The color code guide details specific domains of the proteins represented for each target gene studied. The images were extracted from the original gels to highlight the bands of interest. For TGFBR2 (H), the image presented was generated from juxtaposed images of the same gel.

