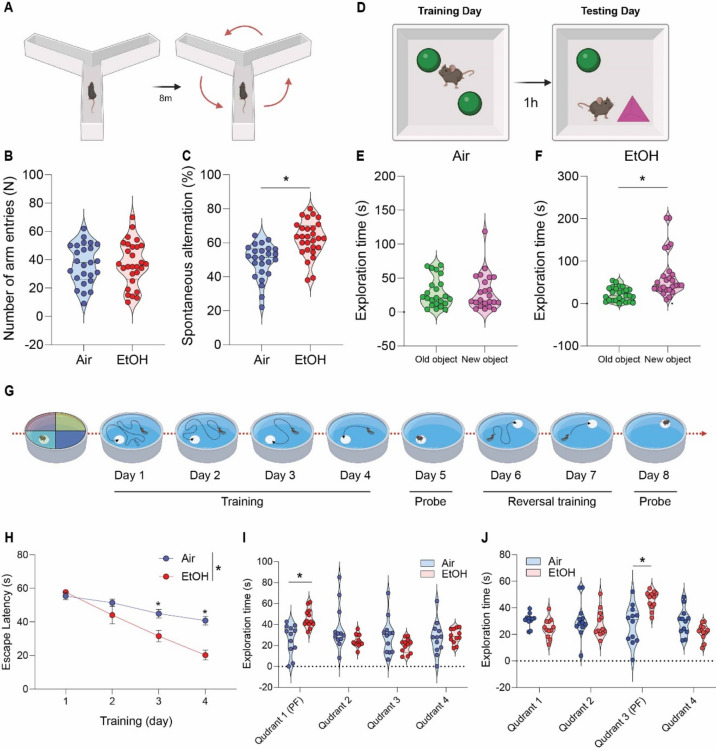
Fig. 6.
Effect of low to moderate ethanol exposure on cognitive performance in presymptomatic APP/PS1 mice. (A) Y-maze schematic diagram, (B) total arm entries and (C) Y-maze test showing spontaneous alteration for air-exposed and ethanol-exposed presymptomatic APP/PS1 mice. (D) Novel Object Recognition (NOR) task schematic diagram, (E and F) NOR task demonstrating time spent exploring familiar and unfamiliar objects for both groups. (G) Morris water maze (MWM) schematic diagram, (H and I) MWM acquisition training and probe test (J) reversal probe test. Data represent mean ± SEM; n = 12 ~ 28 per group. *P < 0.05 comparing each group. (B-C and E–F) Two-tailed Mann–Whitney test (H and J) Two-way ANOVA followed by Tukey’s multiple comparisons tests. See Table S1 for full statistical information.

