Fig. 3.
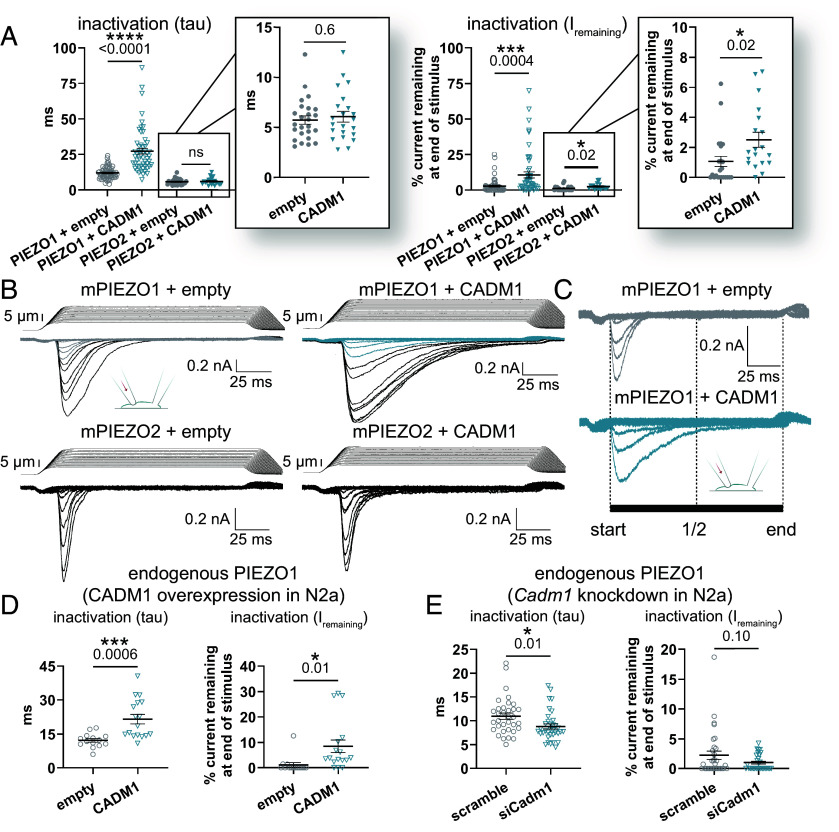
Electrophysiological characterization of the effect of CADM1 on PIEZO channels. (A) Comparison of the effects of CADM1 overexpression on mPIEZO1 and mPIEZO2 overexpressed in HEK293T PIEZO1 KO cells, using whole-cell poke for mechanical stimulation at –80 mV. Left: The inactivation kinetics of mPIEZO1 are slower with CADM1 compared to empty vector control (mean ± SEM: empty, 11.9 ± 0.5 ms, n = 62; CADM1, 27 ± 2 ms, n = 54; P < 0.0001) with little to no effect on mPIEZO2 (mean ± SEM: empty, 5.7 ± 0.4 ms, n = 25; CADM1, 6.1 ± 0.5 ms, n = 22; P = 0.6). Right: Percent of apparent maximal current (Imax) remaining at the end of the mechanical stimulus is greater for mPIEZO1 with CADM1 compared to empty vector control (mean ± SEM: empty, 2.8 ± 0.7%, n = 58; CADM1, 11 ± 2%, n = 53; P = 0.0004) with a more subtle effect on mPIEZO2 (mean ± SEM: empty, 1.1 ± 0.3%, n = 23; CADM1, 2.5 ± 0.5%, n = 19; P = 0.02). For PIEZO1, data are pooled from eight independent transfections, and statistical significance is observed on each day when data are not pooled (SI Appendix, Fig. S3A). Data for PIEZO2 are pooled from four independent transfections. (B) Representative PIEZO1 (Top) and PIEZO2 (Bottom) traces for the data shown in panel A with and without CADM1 overexpression. (C) Zoomed in view of the currents elicited by the lowest intensity stimuli shown in panel B (gray = empty control, turquoise = CADM1), for clarity. (D) Summary data of whole-cell poke recordings of endogenous mPIEZO1 in N2a cells with transient overexpression of CADM1, showing slowed inactivation (Left panel, mean ± SEM: empty, 12.2 ± 0.8 ms, n = 14; CADM1, 22 ± 2 ms, n = 17; P = 0.0006) and increased Imax % remaining (Right panel, mean ± SEM: empty, 1.1 ± 0.9%, n = 14; CADM1, 9 ± 2%, n = 17; P = 0.01) in the presence of CADM1 that mirrors the effects seen with transient PIEZO1 overexpression in HEK cells (panel A). Data are pooled from three independent recording days. (E) Summary data of whole-cell poke recordings of endogenous mPIEZO1 in N2a cells with siRNA knockdown of endogenous CADM1, showing acceleration of channel inactivation in contrast to the slowing seen with overexpression (Left: nontargeting scramble control, 11.0 ± 0.7 ms, n = 34; siCadm1, 8.8 ± 0.5 ms, n = 35; P = 0.01). Percent Imax remaining is not significantly different between conditions but trends in the opposite direction of overexpression (Right: nontargeting scramble control, 2.3 ± 0.7%, n = 32; siCadm1, 1.0 ± 0.2%, n = 30; P = 0.1). Data are pooled from three independent transfections with the experimenter blinded to conditions.

