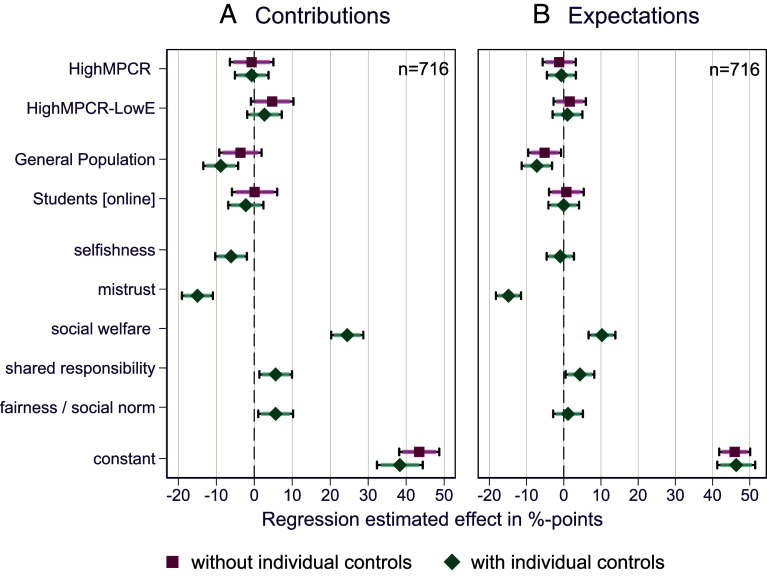
Fig. 3.
Point estimates and CI (90% CI indicated by shaded spikes, and 95% CI indicated by the “caps” at the ends of each side of the CI) from OLS regressions with robust SE for the main behavioral outcomes in Study 1: contribution to the public good in percentage of endowment (A) and individual expectations of the behavior of others in percentage of endowment (B). Explanatory variables in models without individual controls are the treatment dummies (HighMPCR and HighMPCR-LowE) indicating the effect of the respective treatment condition as compared to the LowMPCR condition; and the population dummies (General Population and Students [online]) indicating the effect of the population sample as compared to Students [lab]. In models with individual controls, we include self-reported motivations from postexperimental questionnaires, included as dummy variables that take the value 1 if the participant indicated the respective motivation, and 0 otherwise. Constant indicates the mean of the respective dependent variable for the LowMPCR condition. See SI Appendix, Tables S3 and S4 for the full regression outputs behind this figure.

