Figure 2.

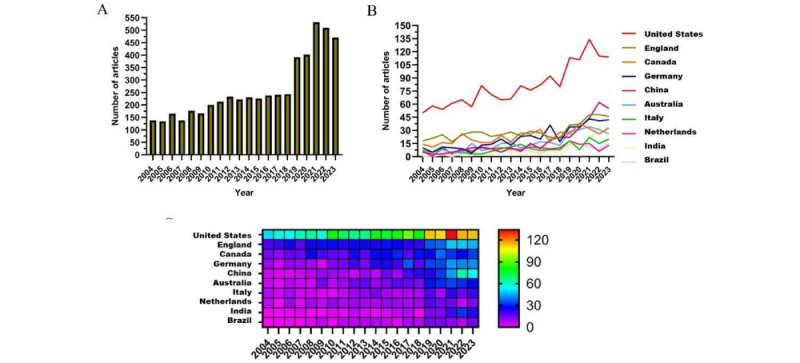
Trend chart of publications in the past 20 years. (A) Annual publication count chart. (B) Line chart of national publication count. (C) Heatmap of national publication count.

Trend chart of publications in the past 20 years. (A) Annual publication count chart. (B) Line chart of national publication count. (C) Heatmap of national publication count.