Figure 3.

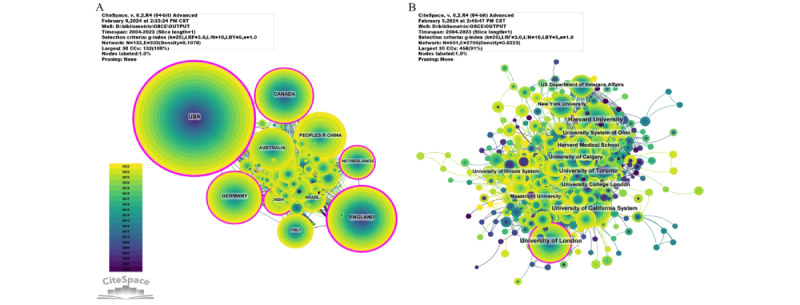
Network graph of national and institutional collaborations. (A) Network graph of national collaborations. (B) Network graph of institutional collaborations. The bubble size represents the number of publications. WoS: Web of Science.

Network graph of national and institutional collaborations. (A) Network graph of national collaborations. (B) Network graph of institutional collaborations. The bubble size represents the number of publications. WoS: Web of Science.