Figure 5.
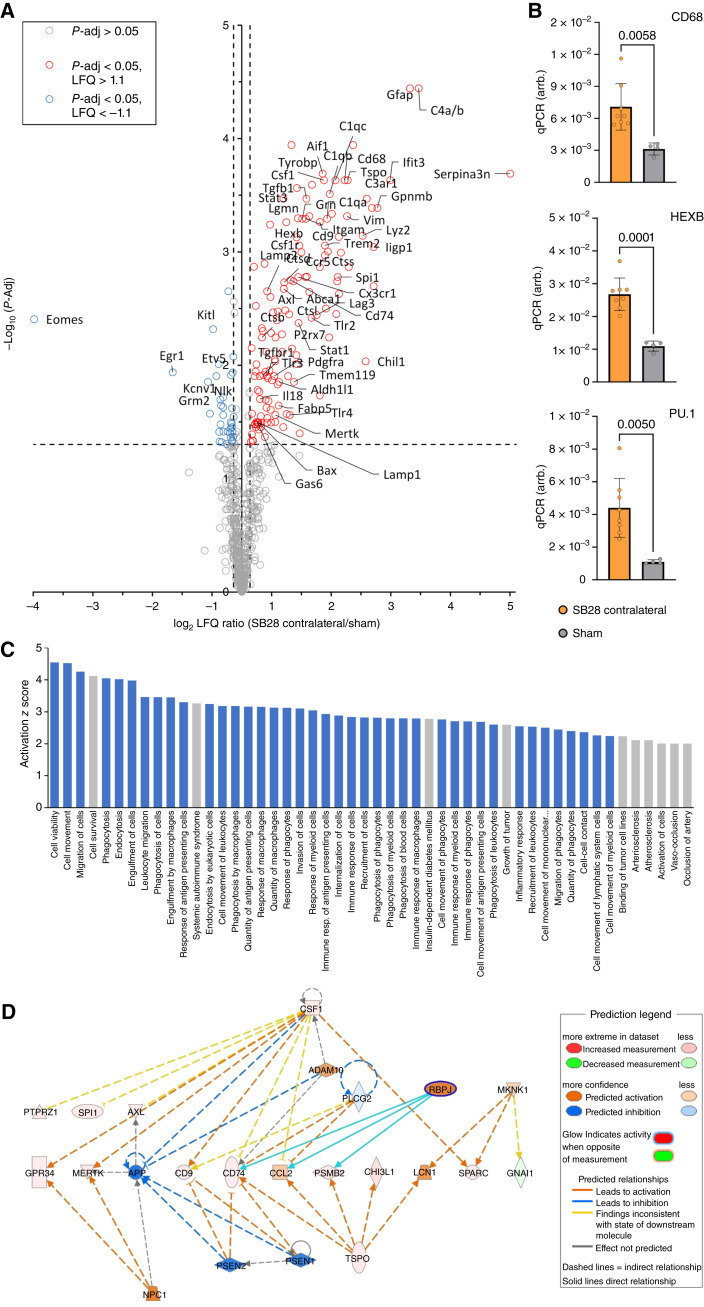
Contralateral hemispheres of SB28 glioblastoma mice indicate signatures of disease-associated myeloid cells and immunosuppression. A, Volcano plot highlights genes with significant upregulation and downregulation in the contralateral hemisphere of SB28 glioblastoma mice (red and blue, respectively) compared to sham. B, qPCR reveals higher expression of genes related to an inflammatory myeloid cell state in contralateral hemispheres of SB28 glioblastoma mice in contrast to sham. C, Illustration of the 50 pathways with highest elevation in immune cells of the contralateral hemisphere of SB28 glioblastoma mice (informed by IPA). Note that 40 out of the 50 pathways with highest activation were related to cell migration (phagocytes, leukocytes), phagocytosis, and immune cell activation (indicated in blue). D, IPA network analysis based on altered gene expression signatures in contralateral hemispheres of SB28 glioblastoma mice in contrast to sham. Depicted is a network plot showing TSPO-mediated associations with poor prognosis (e.g., CCL2) and immunosuppression (e.g., CHI3L1).

