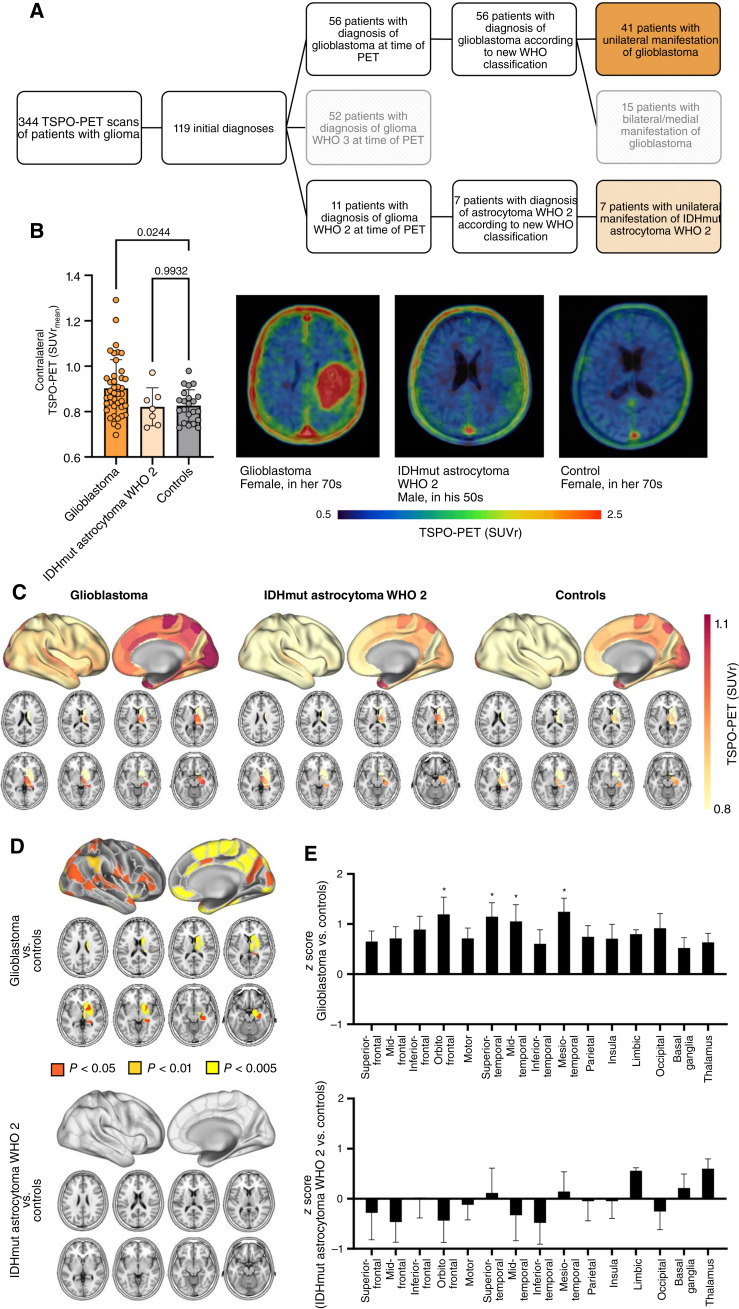
Figure 1.
Elevated TSPO-PET signals in the non-lesional hemisphere of patients with glioblastoma. A, Patient selection process. Patients receiving TSPO-PET imaging at initial diagnosis of glioma were allocated. Patients with unilateral manifestation of glioblastoma (WHO IV; n = 41) or isocitrate dehydrogenase mutant astrocytoma WHO grade 2 (IDHmut astrocytoma WHO 2; n = 7) at the time of PET were selected for further analysis. B, Patients with newly diagnosed glioblastoma but not patients with IDHmut astrocytoma WHO 2 indicate higher TSPO-PET signal in the contralateral hemisphere compared to healthy controls. Images represent examples of TSPO-PET images of patients with newly diagnosed glioblastoma (left) and IDHmut astrocytoma WHO 2 (middle) in comparison to a healthy control (right). C, Surface projections and axial slices of the group average contralateral TSPO-PET signal of patients with glioblastoma, IDHmut astrocytoma WHO 2, and healthy controls. The non-lesional hemispheres were parcellated into 123 sub-regions using the Brainnetome Atlas. Axial slices show TSPO-PET signals of basal ganglia regions (masked cortical regions). D, Significant TSPO-PET signal elevation in brain regions of the contralateral hemisphere of patients with glioblastoma but not with IDHmut astrocytoma WHO 2 compared to healthy controls. E, Pronounced contralateral TSPO expression in orbito-frontal, superior-temporal, mid-temporal, and mesio-temporal regions of patients with glioblastoma. *, P < 0.01.

