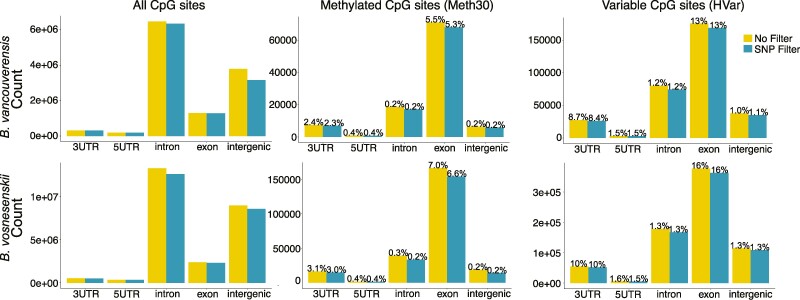
Fig. 2.
The distribution of CpG's in genomic features across all sequenced CpG's, methylated CpG's, and variables CpG's both with and without SNP filtering. The height of the bar indicates the total number of CpG's found in a given feature for a given dataset. Numbers indicate the portion of sequenced CpG's located in that feature that was methylated.

