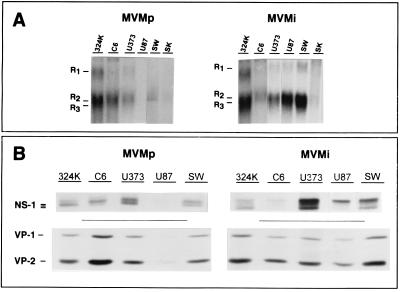
FIG. 3.
MVM gene expression in transformed nervous cells. Cells were infected at 5 PFU/cell with MVMp or MVMi and were analyzed for viral transcription and protein synthesis in the first round of infection. (A) Northern blot analysis of messengers accumulation at 15 hpi. Five micrograms of total RNA was loaded per slot, and filters were exposed for autoradiography for 2 days with an intensifying screen at −70°C. The positions of the three R1, R2, and R3 viral mature transcripts are indicated. R2 and R3 are not well resolved due to their similar size. (B) PAGE analysis of MVM nonstructural (NS1) and structural (VP1 and VP2) protein synthesis. Cells were labeled 12 to 20 hpi with [35S]Met-Cys, and proteins were immunoprecipitated with specific antibodies. An equivalent of 105 infected cells was loaded per slot. Gels were exposed for autoradiography for 4 days.

